Robinhood (HOOD) Stock: Two Numbers for One Adjusted EPS
Contents
- Robinhood (NASDAQ: HOOD) posted record third-quarter 2026 revenue of $1.42 billion, but growth slowed to +11.8% and GAAP diluted EPS fell -16% from $0.61 to $0.51. In the same quarter the company introduced two new non-GAAP measures, Adjusted Net Income and Adjusted EPS. The reconciliation in the earnings release filed with the 8-K and the one on slide 47 of the IR deck carry opposite signs for the tax effect of the adjustments, so the same second quarter shows Adjusted EPS of $0.50 in the release and $0.55 in the deck. What remains open is what the new yardstick tells investors in a year when growth is coming down.
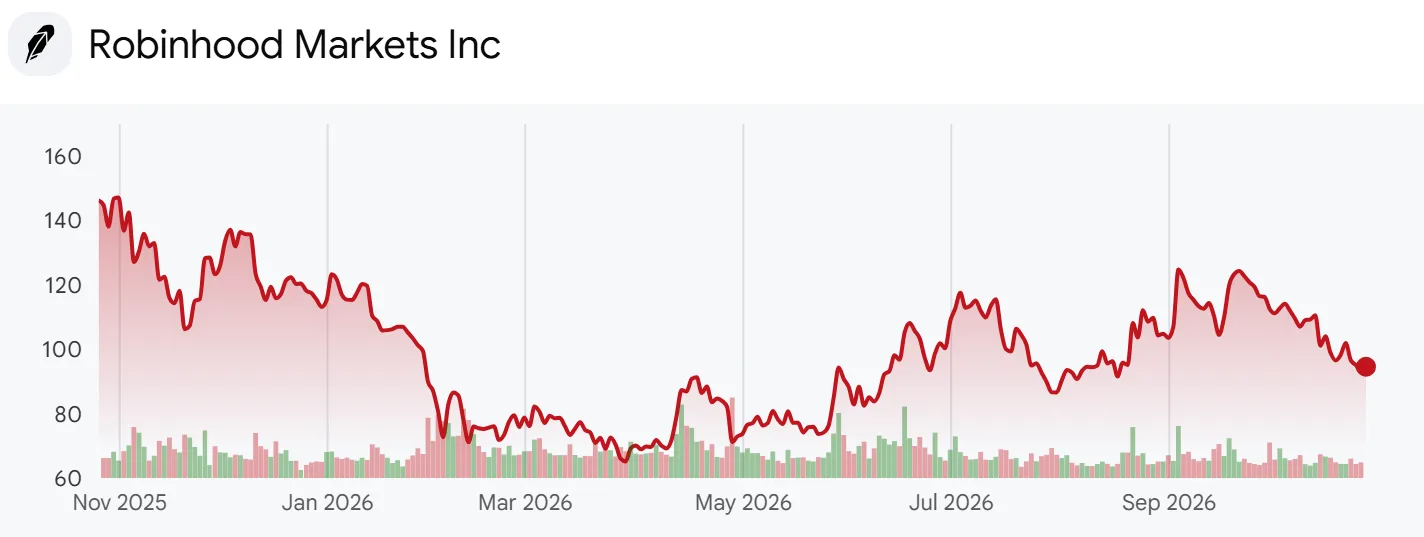
- Robinhood started as a commission-free app for stocks, options and crypto and now also runs prediction-market event contracts, the Gold subscription, a credit card, banking and retirement accounts. At $94.56 a share the company is worth $85.0 billion. The stock is -16.4% in 2026 and -35.6% below its October 2025 month-end high of $146.78. The analysis lines up nine quarters of revenue detail and the adjustment tables in the 49-page Q3 deck with the third-quarter earnings release and the 10-Q, and checks them against the Q1 and Q2 decks and the June 8-Ks on the convertible notes and layoffs. The P/E uses trailing twelve-month (TTM) GAAP diluted EPS of $2.17, or 43.58 times; the valuation band swaps Q4 2024 GAAP EPS of $1.01 for the company’s $0.54 figure before a tax benefit. Event contracts are derivatives that pay out on the outcome of an event such as a game or an economic release.
What the Q3 Deck Says About Adjusted EPS
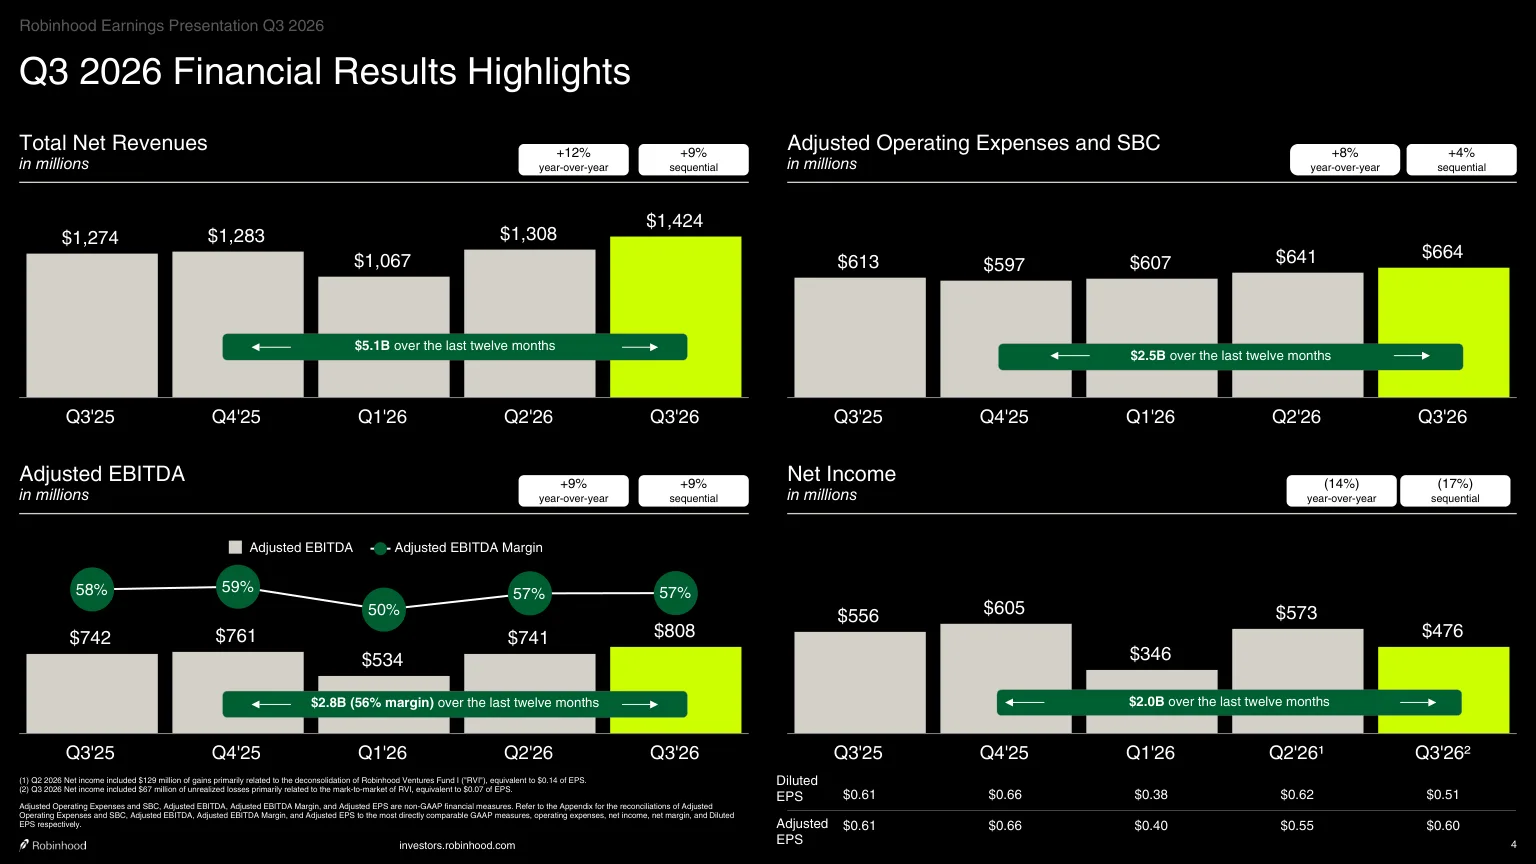
- Slide 4 of the Q3 deck sets four panels side by side: revenue of $1.42 billion (+12%), Adjusted Operating Expenses and SBC of $664 million (+8%), adjusted EBITDA of $808 million (+9%) and net income of $476 million (-14%). Under the net income bars it adds two lines. From Q3 2025 onward, diluted EPS reads $0.61, $0.66, $0.38, $0.62 and $0.51, while Adjusted EPS reads $0.61, $0.66, $0.40, $0.55 and $0.60. The footnotes say Q2 included a $129 million gain, or $0.14 a share, mainly from deconsolidating Robinhood Ventures Fund I (RVI), and Q3 included $67 million of unrealized losses on RVI, or $0.07.
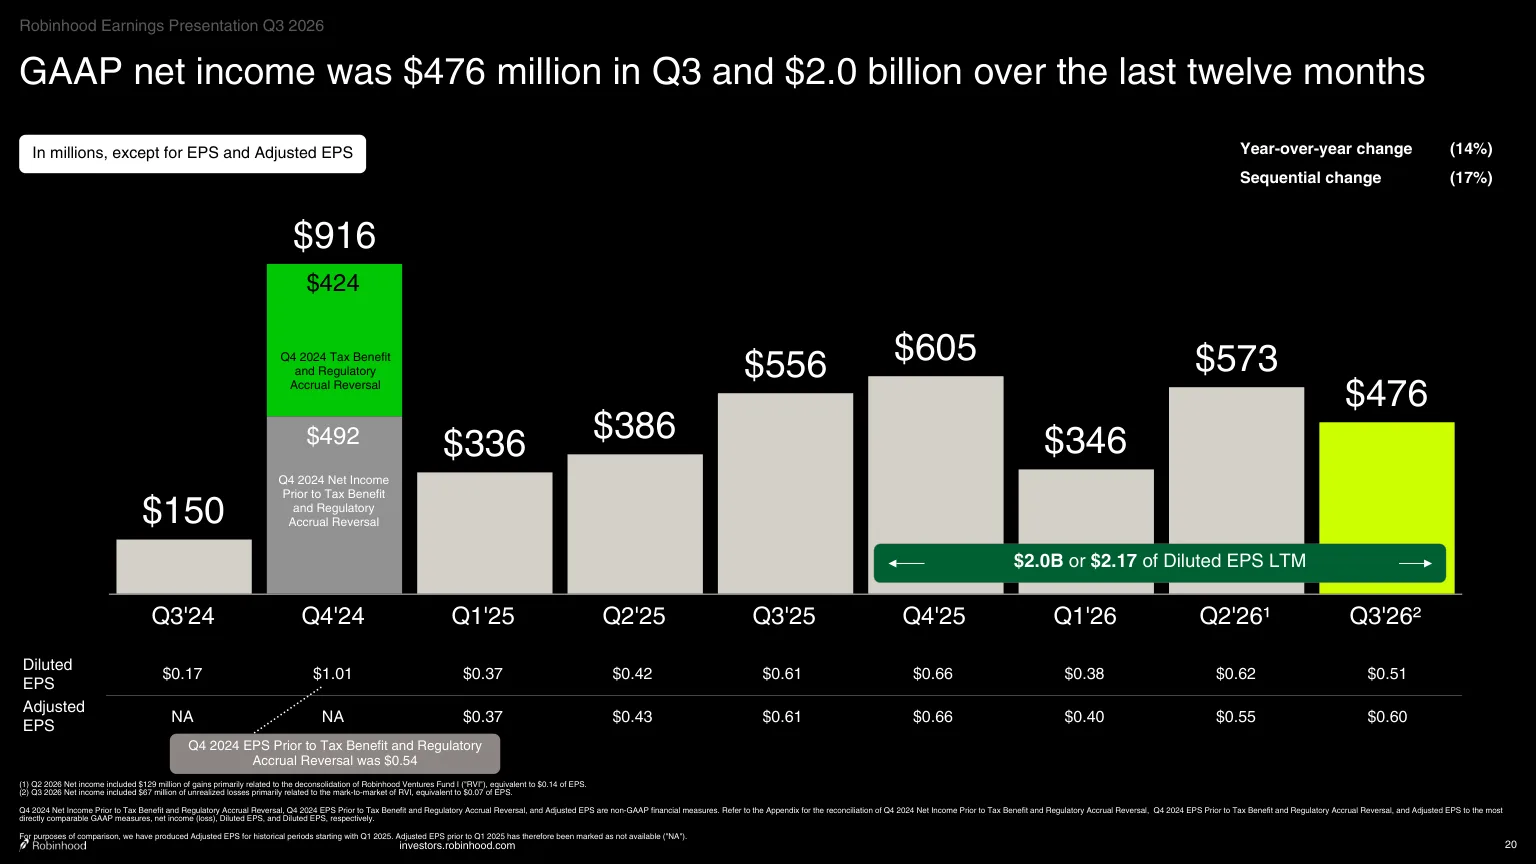
- Slide 20 extends net income to nine quarters. Of the $916 million earned in Q4 2024, $424 million came from a deferred tax benefit and a regulatory accrual reversal. A footnote adds: “For purposes of comparison, we have produced Adjusted EPS for historical periods starting with Q1 2025.” The phrase Adjusted EPS appears 14 times in the Q3 deck and not once in the Q1 or Q2 decks, and the 10-Q does not use it at all. The release explains that the measures were “introduced this quarter to provide a view of profitability before certain non-operating items.”
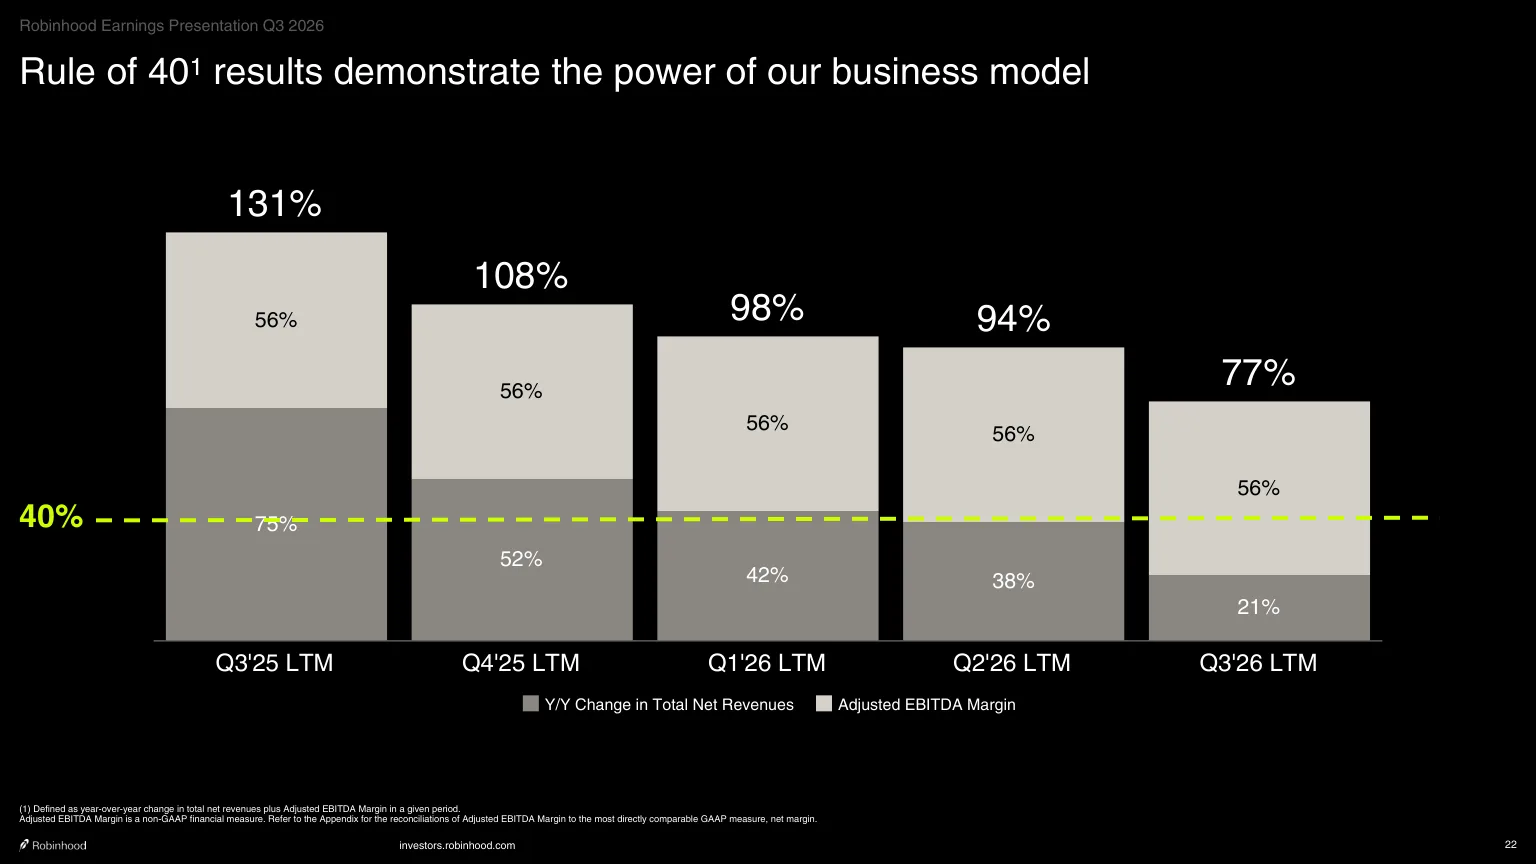
- Slide 22 uses the Rule of 40, revenue growth plus adjusted EBITDA margin, to “demonstrate the power of our business model.” On a trailing twelve-month basis the total fell from 131% in Q3 2025 to 108%, 98%, 94% and 77%. In the same bars, TTM revenue growth went from 75% to 52%, 42%, 38% and 21%, while the adjusted EBITDA margin stayed at 56% in all five. The total still clears 40%, but the part that shrank every quarter is growth.
- Slide 10 puts Q3 net deposits at $15.7 billion, a 17% annualized rate against platform assets, the lowest of the nine quarters on the slide, whose rates run 29%, 42%, 37%, 25%, 29%, 19%, 22%, 28% and 17%. Slide 18 lowers the top of the 2026 outlook for Adjusted Operating Expenses and SBC by $25 million to $2.675 billion to $2.75 billion, citing efficiency gains. Subtracting the $1.912 billion spent through Q3 leaves $800.5 million for Q4 at the midpoint, +20.6% above Q3’s $664 million.
- Company disclosure (Q3 earnings release): CFO Shiv Verma said, “Customers are trusting us with more of their assets as we deliver on our product roadmap, leading to our highest quarter ever for revenues.” October net deposits had already topped $13 billion month to date, including $6 billion from the Dell family’s contribution to Trump Accounts.
Two Versions of Adjusted Net Income
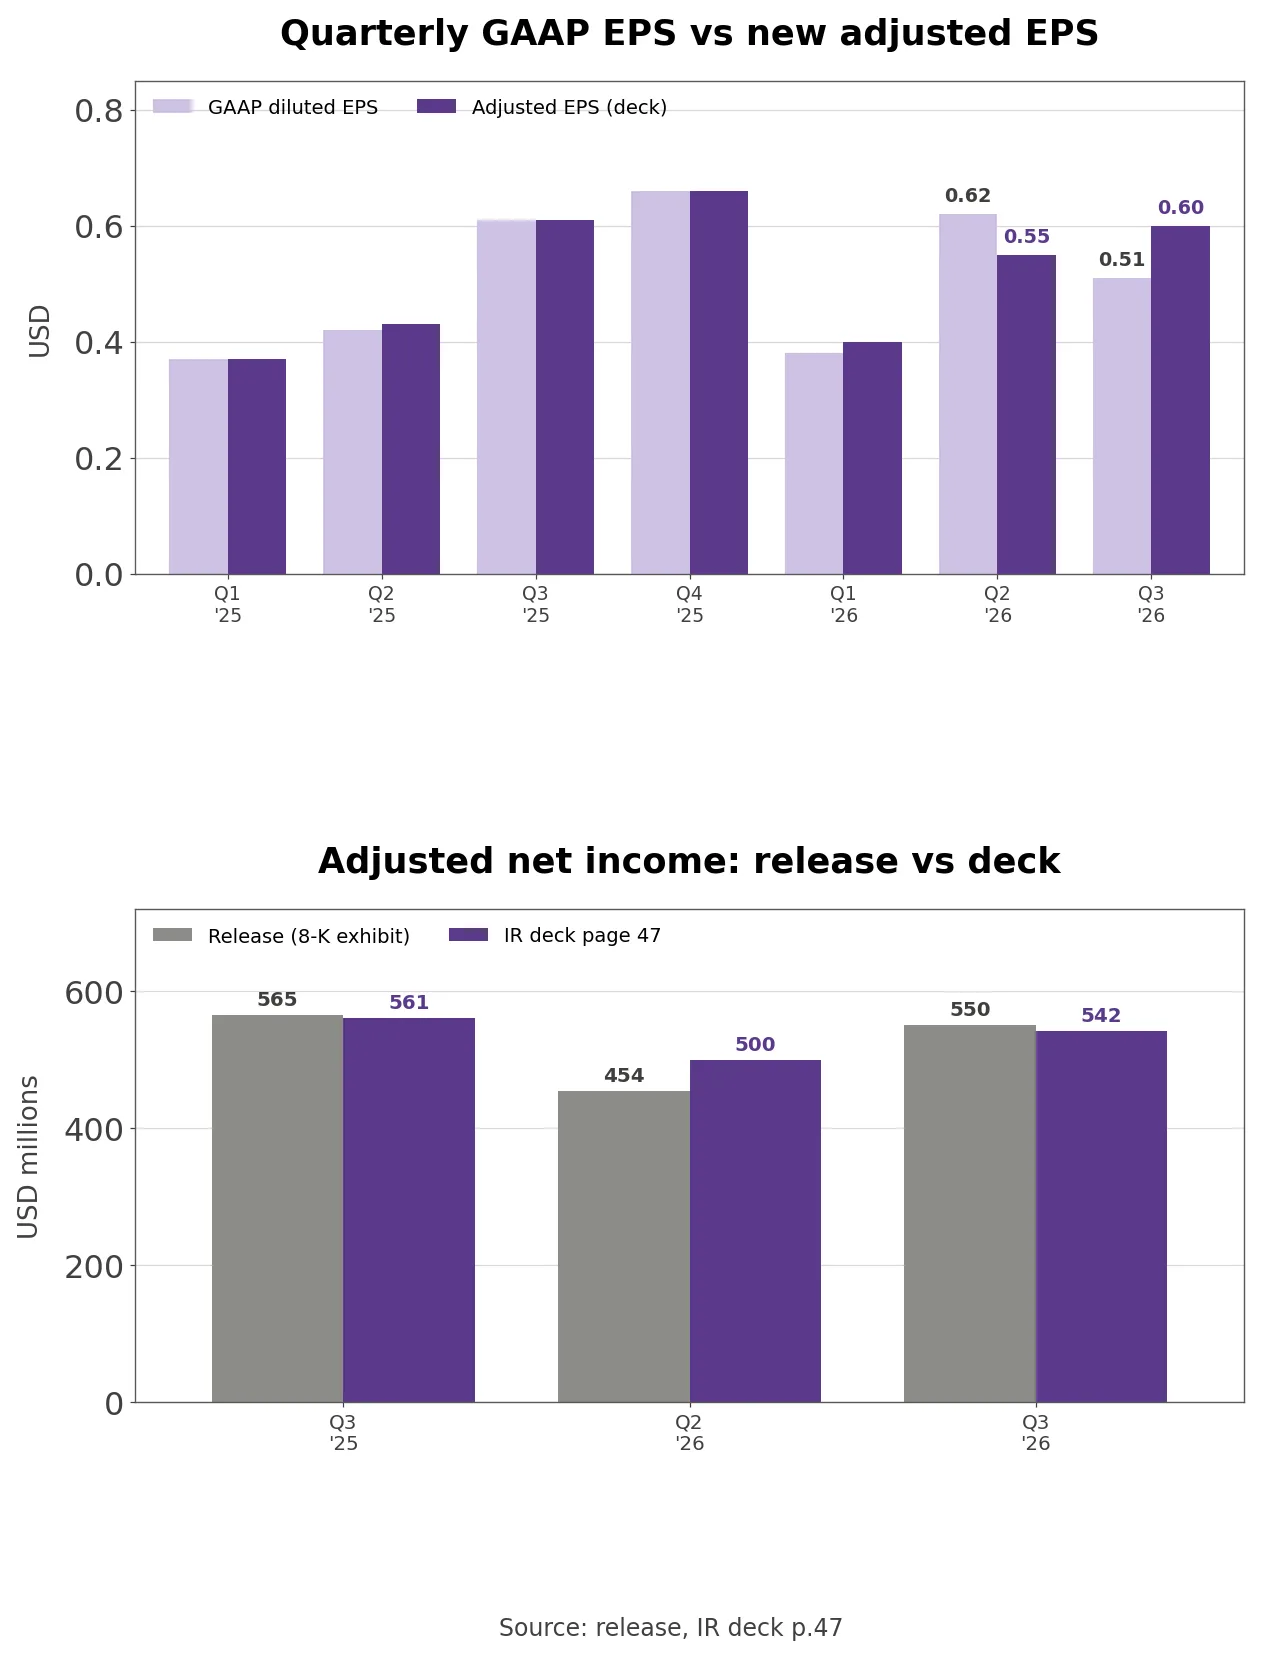
- The reconciliation in the release starts from net income attributable to Robinhood of $468 million, adds $2 million of SBC tied to the CFO transition, $67 million of unrealized losses and $9 million of intangible amortization, then adds a $4 million tax impact to reach Adjusted Net Income of $550 million. Slide 47 adds the same items and subtracts the $4 million to reach $542 million. Same quarter, same items, opposite sign on the tax line.
- The gap is wider in Q2. That quarter’s adjustment removes the $129 million RVI gain, with a $23 million tax impact. The release subtracts it and gets $454 million, or $0.50 a share; the deck adds it and gets $500 million, or $0.55. Q3 2025 also differs: $565 million ($0.62) in the release against $561 million ($0.61) in the deck. When adjustments raise pre-tax income, the tax effect normally reduces it, so the deck’s direction looks like the conventional one.
- Own calculation (adjusted EPS): The headline “Adjusted EPS down 3%” comes from the release, $0.62 to $0.60, or -3.2%. On deck figures it is $0.61 to $0.60, or -1.6%, and Adjusted Net Income falls 2.7% in the release and 3.4% in the deck. For the first nine months of 2026 the release shows $1.375 billion while the deck’s quarters add to $1.409 billion; on the release’s 913 million diluted shares that is $1.54 a share against the release’s $1.51.
- The new measure does not only flatter results. In Q2 Adjusted EPS sits $0.12 (release) or $0.07 (deck) below GAAP EPS of $0.62, and in Q3 it sits $0.09 above. Over nine months the release shows Adjusted EPS and GAAP EPS both at $1.51, so the gains and losses largely cancel. The open issue is that a measure defined for the first time came out with two different numbers in two company documents, and the Q4 release will show which Q2 figure the company keeps.
The Bull and Bear Case for Robinhood Shares
- The bull case rests on assets and activity. Platform assets reached $396 billion (+19%), Gold subscribers 5.2 million (+34%), equity notional volume $992 billion (+53%), options contracts 905 million (+48%) and the margin book $22.1 billion (+59%), all records. Fourteen business lines now earn $100 million or more a year, and October deposits topped $13 billion by mid-month.
- The bear case rests on the pace and source of growth. TTM revenue growth fell from 75% to 21% in a year, and of the $150 million Q3 revenue increase, event contracts added $146 million while crypto took away $148 million. Those event contracts now face state pushback: Robinhood agreed to stop offering new sports-related contracts in Ohio by November 2. Monthly active users fell 0.8 million from a year earlier to 13.0 million.
From Layoffs to an Event Contract Exchange
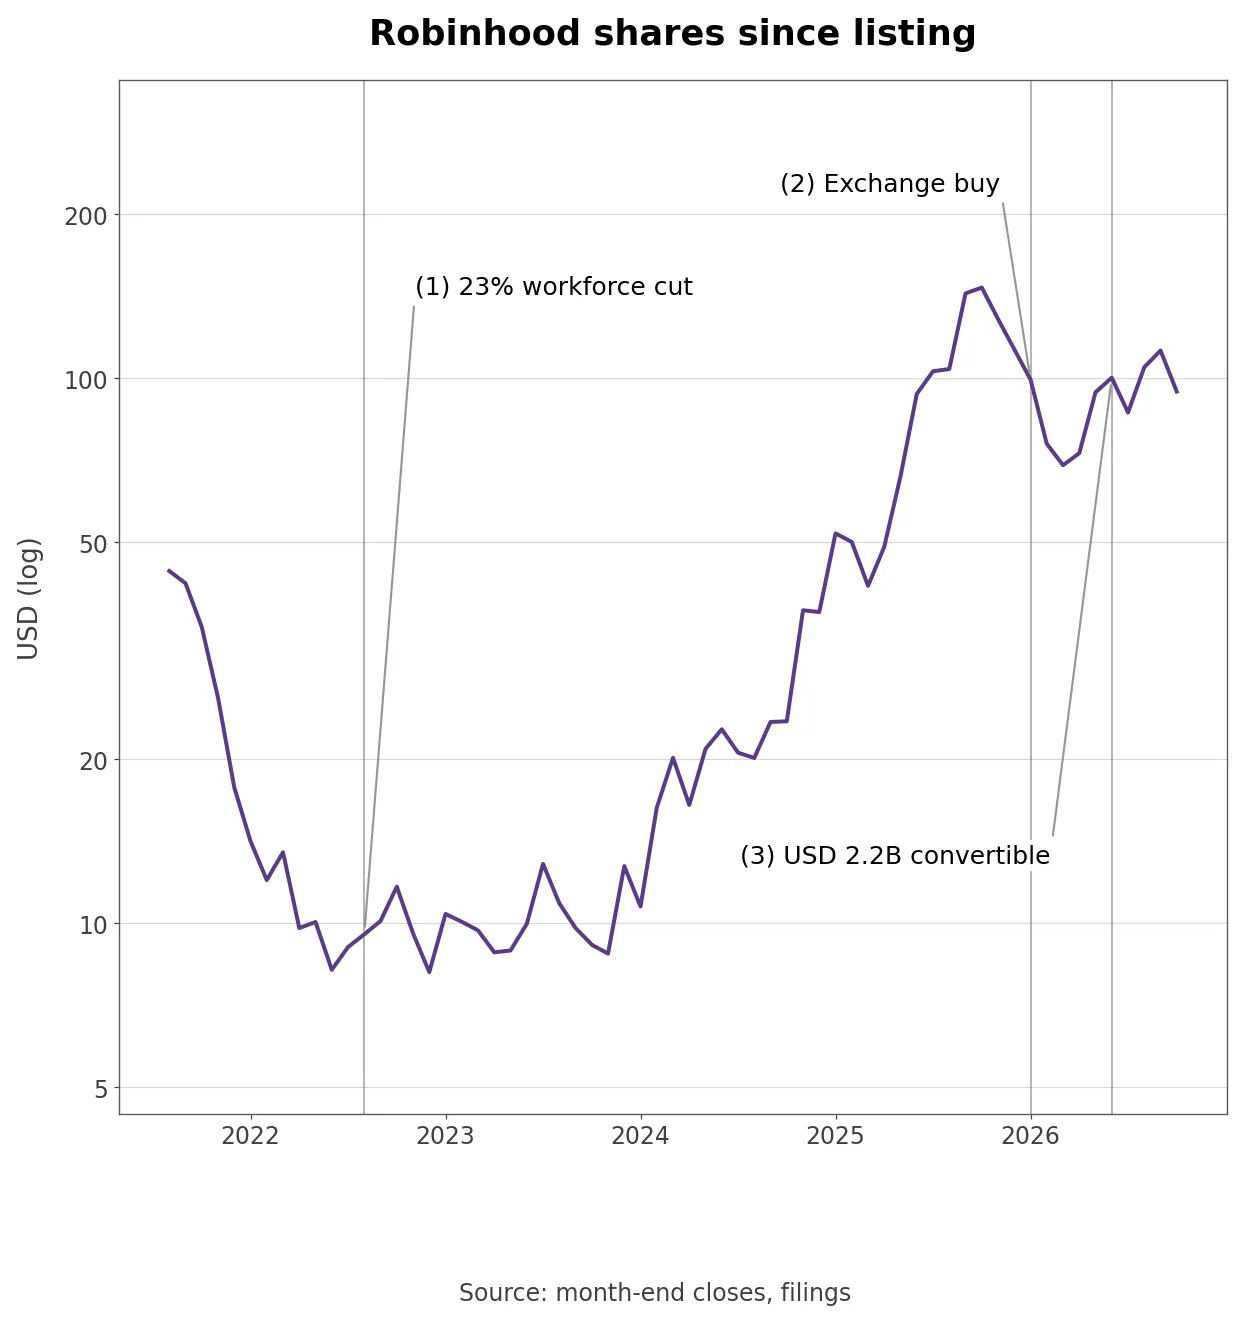
- Robinhood listed in 2021, and its first month-end close of $44.32 in August 2021 fell to $8.22 by June 2022. The company cut about 9% of staff in April 2022 and about 23% in August. Quarterly EPS went from -$0.57 in Q1 2023 to $0.18 in Q1 2024, 2024 was profitable for the full year, and the stock rose +192.5% in 2024 and +203.5% in 2025 on month-end closes, 17.9 times from the June 2022 low to October 2025.
- 2026 changed the shape of the company. In January, Rothera, a joint venture with Susquehanna International Group (SIG), paid about $79 million for 90% of MIAXdx, a CFTC-licensed exchange and clearinghouse now called Rothera E&C that offers futures and derivatives including prediction markets. Shiv Verma became CFO in February and the CTO left in May. In June the company cut about 10% of staff, saying it acted “from a position of business strength,” and sold $2.2 billion of 0% convertible notes due October 2029 with a $174.42 conversion price, using $290 million of the proceeds to buy back 2.743 million shares.
Where Did the $150 Million of Q3 Revenue Growth Come From?
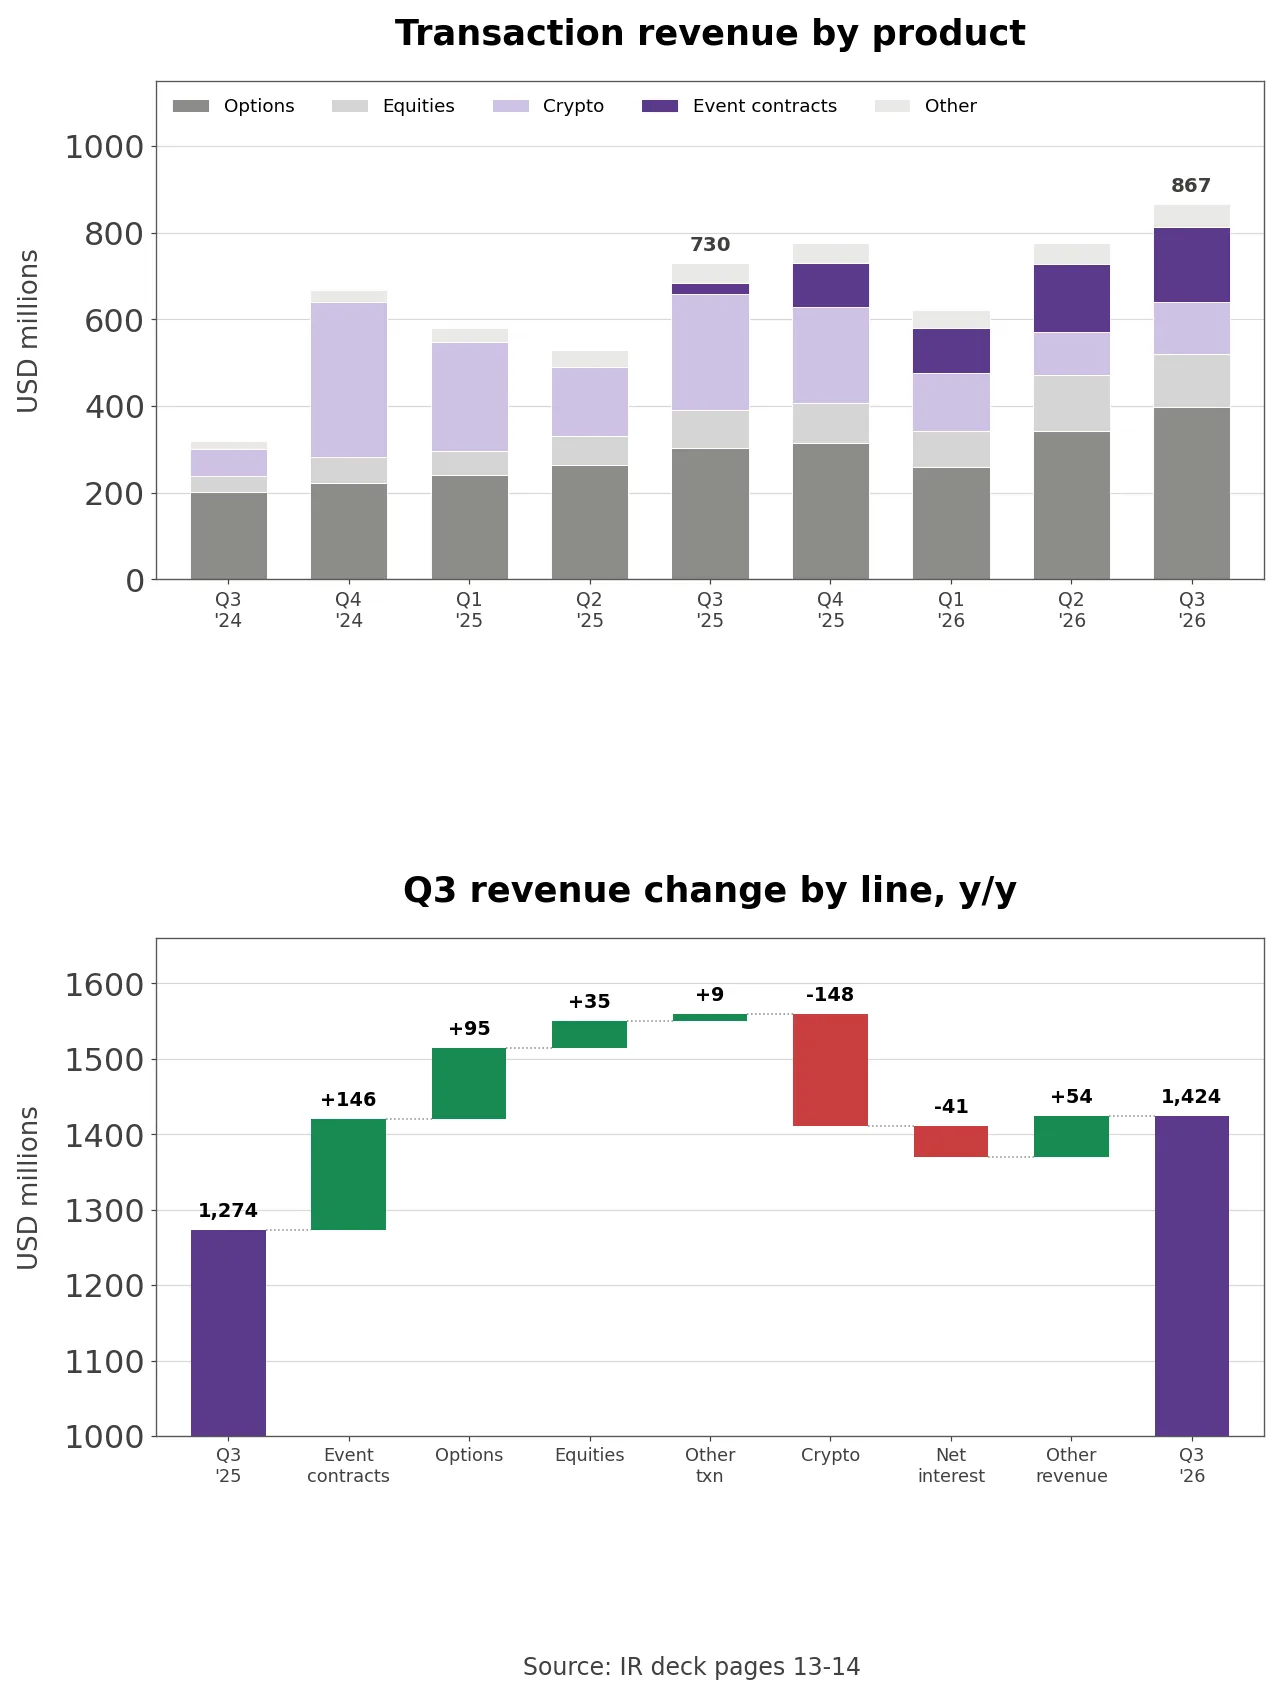
- Transaction revenue rose +19% to $867 million. Event contracts grew from $27 million to $173 million, 6.4 times; options rose 31% to $399 million and equities 41% to $121 million, while crypto fell -55% from $268 million to $120 million. Crypto’s share of transaction revenue dropped from 36.7% to 13.8%, and event contracts now supply 20.0%.
- Net interest revenue fell 9% to $415 million, its first year-over-year decline in the deck’s nine quarters. Securities lending swung from $87 million to -$19 million, which slide 41 attributes to “reduced demand for hard-to-borrow securities,” while margin interest rose from $153 million to $244 million and credit card interest from $17 million to $50 million. Other revenue rose from $88 million to $142 million, of which $47 million was Trump Account service revenue.
- Quarterly revenue growth ran +100.0% in Q3 2025, +26.5% in Q4, +15.1% in Q1 2026, +32.3% in Q2 and +11.8% in Q3. The Q3 2025 base was lifted by $268 million of crypto revenue, so once crypto halved, revenue grew only as much as other lines could fill in.
Costs and Mark-to-Market Losses Behind Lower EPS
- While revenue rose $150 million, GAAP operating expenses rose $100 million to $739 million. The provision for credit losses climbed from $26 million to $71 million as the credit card book grew, and costs tied to Trump Accounts, Rothera and marketing were added. The company’s own Adjusted Operating Expenses and SBC rose only 8% to $664 million, so much of the increase sits in items outside its outlook, mainly credit losses.
- Own calculation (operating margin): Using quarterly operating income from market data, GAAP operating margin slipped from 49.8% ($635 million) to 48.1% ($685 million). Operating income rose $50 million, but the $67 million RVI loss below the operating line took net income attributable to Robinhood from $556 million to $468 million.
- Some costs come straight out of revenue. Robinhood pays customers a match when they transfer assets from other brokers or contribute to retirement accounts, records the match as an asset and amortizes it against revenue over about four years. The Q3 contra revenue was $60 million; matches paid since 2023 total about $1.19 billion, and about $768 million remains to be amortized.
How Robinhood Makes Money
- Q3 revenue split 60.9% transaction-based, 29.1% net interest and 10.0% other. Transaction revenue comes mostly from routing customer orders to market makers and from crypto and event contract fees, and the release’s risk factors cite “our reliance on transaction-based revenue, including payment for order flow.” Net interest comes from margin loans, customer cash, securities lending and the credit card; other revenue is mainly Gold fees and Trump Account services.
- Slide 16 counts businesses with $100 million or more in annualized revenue: one in 2019, three in 2020, nine in 2024, eleven in 2025 and fourteen in 2026, with Rothera added in Q3. Funded customers reached 28.7 million (+1.9 million), investment accounts 30.4 million and ARPU $200 (+5%). WonderFi customers, acquired on June 1, count from June. Monthly active users, however, were 13.0 million, 45.3% of funded customers, down 1.1 million in a single quarter, so trading revenue leans more on a smaller group of active users.
- Gold is a paid membership: after a 30-day trial, subscribers pay a flat fee for perks the 10-K lists, including higher cash sweep interest, a 3% IRA match and no interest on the first $1,000 of margin. Subscribers reached 5.2 million, 18% of funded customers and about 40% of new ones. The Gold Card has 1.3 million customers and more than $19 billion of annualized payment volume, and Robinhood Banking holds nearly $5 billion from over 350 thousand customers. Robinhood custodies Trump Accounts; the Treasury’s automatic enrollment created accounts for nearly 70 million children, and a $6.25 billion Dell pledge put $250 in 25 million of them.
The Regulatory Risk Around Event Contracts
- Event contracts generated $173 million in Q3 on 16.4 billion contracts traded, more than seven times a year earlier. The 10-Q says Robinhood controls Rothera through its right to appoint the CEO and a board majority, and Rothera E&C holds DCM, DCO and SEF licenses. “Rothera reached over $100 million in annualized revenues in its first full quarter of operation,” the release says.
- The same 10-Q lists the risks. On October 2 the Ohio Casino Control Commission demanded that Robinhood stop offering sports-related event contracts in the state, and on October 26 Robinhood agreed to stop new sports contracts there by November 2 while appeals proceed. Kentucky has sued Kalshi, Robinhood and Coinbase. Illinois taxes prediction-market operators from July 2026, and North Carolina and Kentucky from January 2027. On federal excise tax, the company states: “We have not collected or remitted federal excise tax on event contracts offered through RHD because we do not believe these contracts are subject to such tax.”
How Robinhood Compares With Three Brokerage Peers
- The peers are Interactive Brokers, an electronic broker with many professional and international clients; Charles Schwab, the largest full-service broker by client assets; and Coinbase, which competes head-on in crypto and prediction markets.
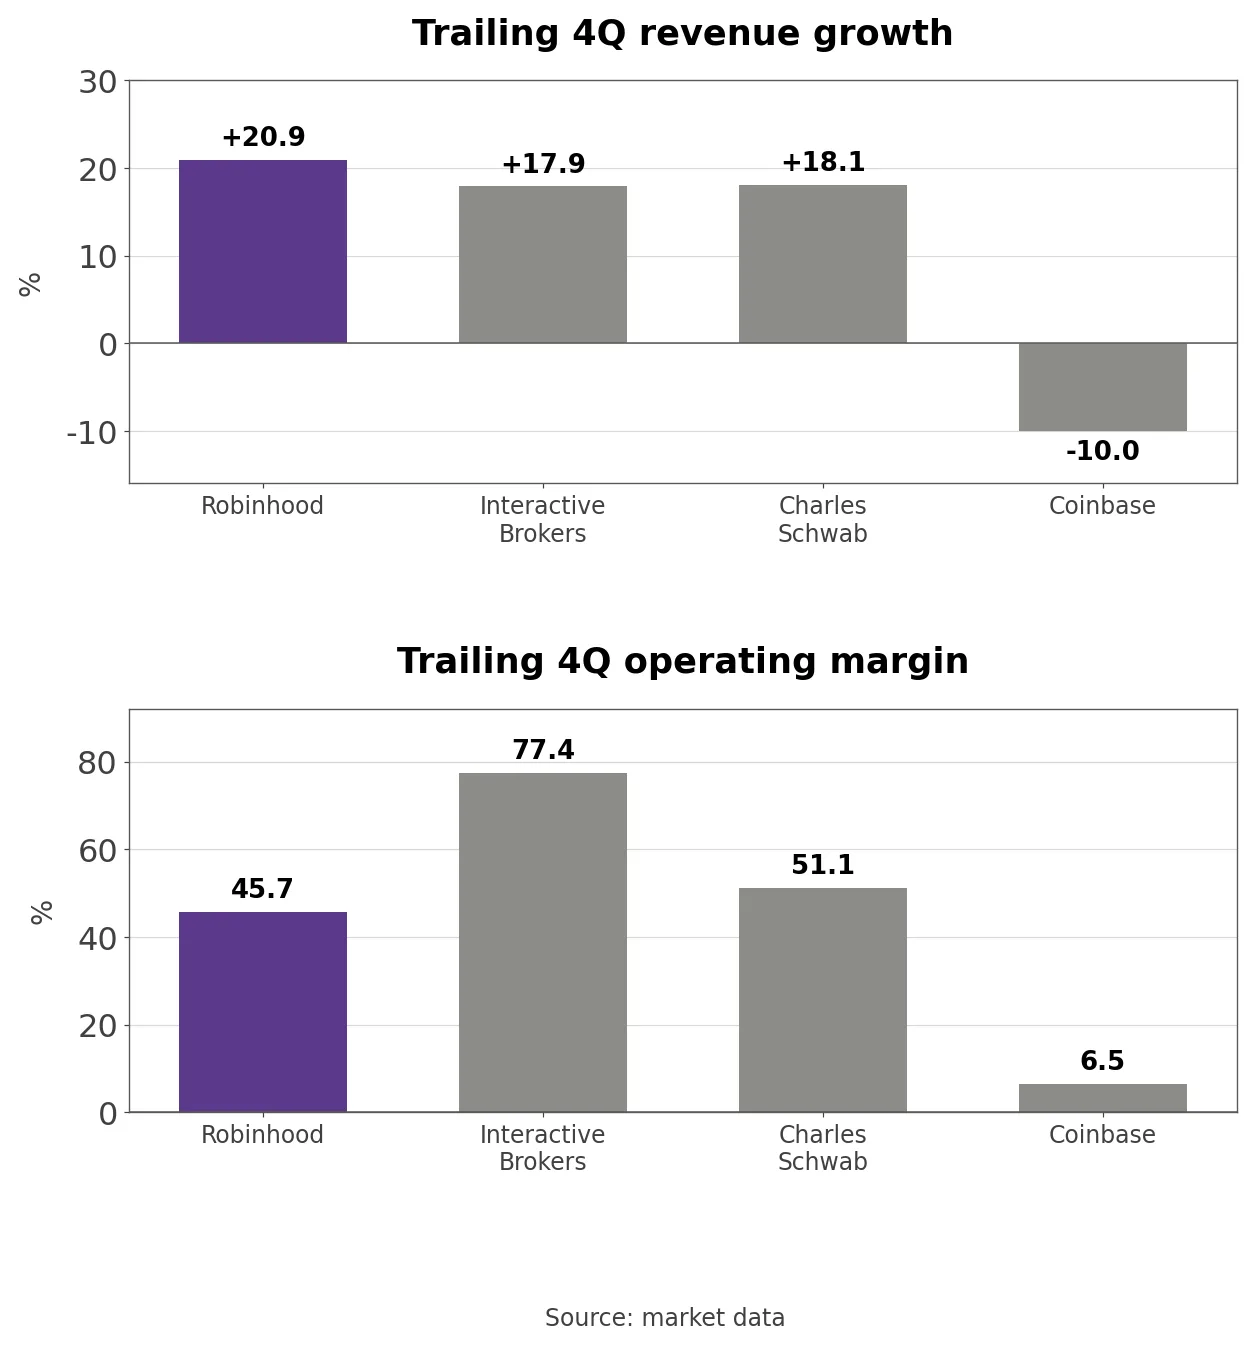
- Over each company’s latest four quarters, revenue grew +20.9% at Robinhood, +18.1% at Schwab and +17.9% at Interactive Brokers, while Coinbase fell -10.0% (through Q2 2026). Operating margins rank Interactive Brokers 77.4%, Schwab 51.1%, Robinhood 45.7% and Coinbase 6.5%. A year ago Robinhood’s TTM growth was 75%; now it grows at about the peers’ pace with the third-highest margin.
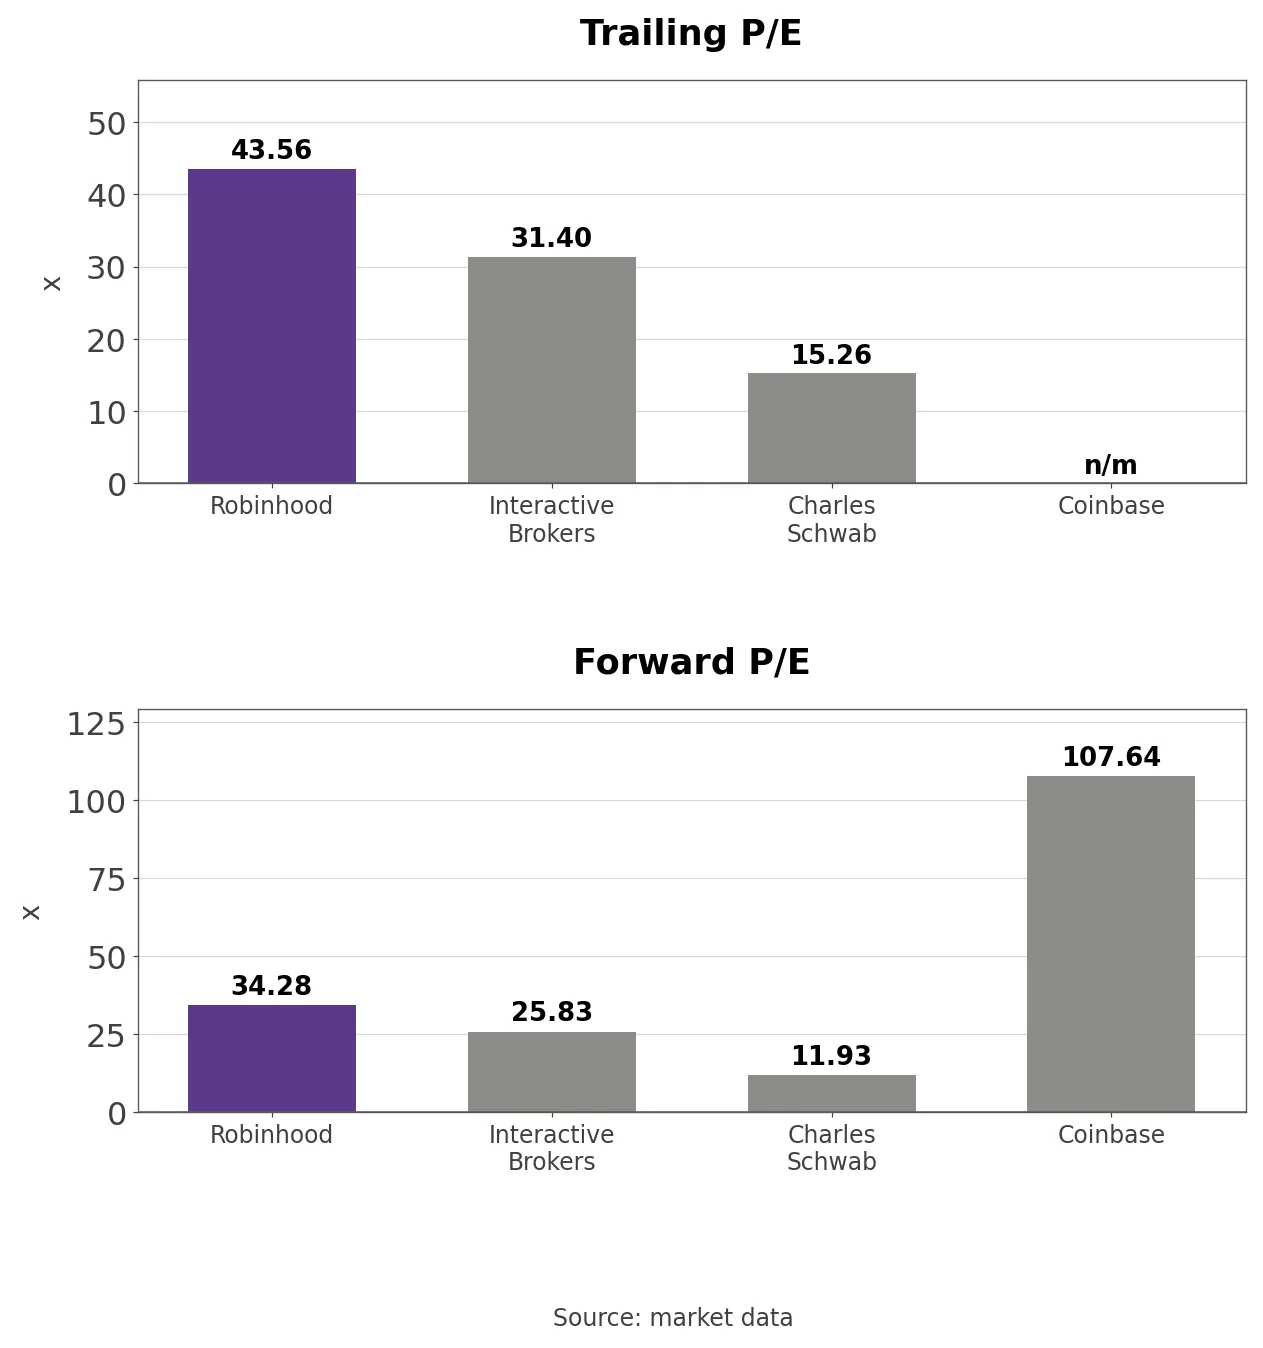
- The multiples have not caught up. Robinhood trades at 43.56 times trailing earnings, 1.4 times Interactive Brokers’ 31.40 and 2.9 times Schwab’s 15.26, while Coinbase lost money over the past four quarters. Forward P/E is 34.28 for Robinhood, 25.83 for Interactive Brokers, 11.93 for Schwab and 107.64 for Coinbase. On capital, Robinhood has bought back $1.3 billion of stock since Q3 2024, 27 million shares at about $48, and $690 million this year. Slide 23 shows $6 billion of corporate cash, investments and stablecoin; net of the $2.2 billion convertible, that is about $3.8 billion of net cash, and diluted shares were 918 million against 922 million a year earlier.
Robinhood’s P/E and Price-to-Book Band
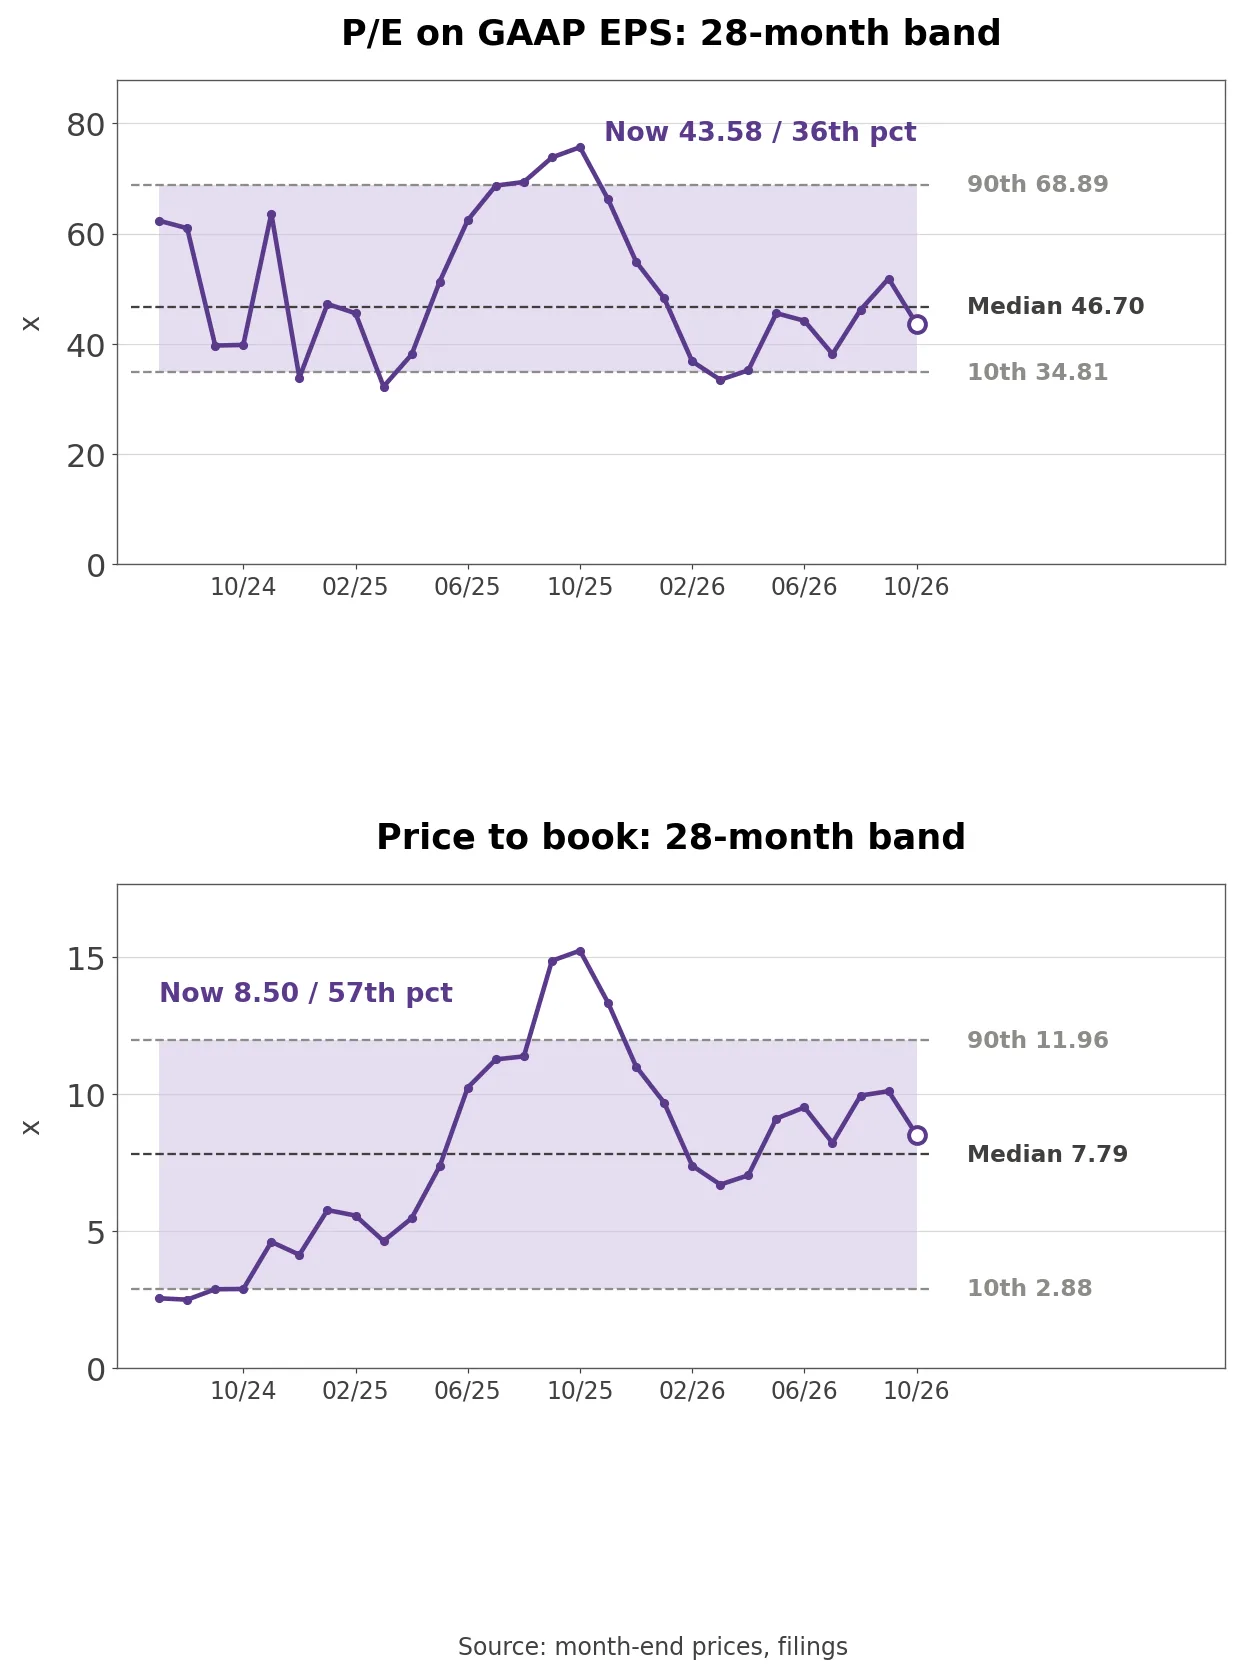
- The P/E on TTM GAAP EPS is 43.58, in the 36th percentile of the 28 months since July 2024. The median is 46.70, the low 32.26 in March 2025 and the high 75.66 in October 2025. Price-to-book is 8.50, in the 57th percentile against a median of 7.79. TTM EPS slipped from $2.27 in Q2 to $2.17 in Q3, the first decline in the band period. On the 2026 consensus of $2.17 the stock trades at 43.6 times, and on the 2027 consensus of $2.96 at 31.9 times.
- Outside view (consensus estimates, market data): The average Q4 EPS estimate is $0.63 from 22 analysts, and the average 2027 revenue estimate of $6.86 billion from 28 analysts is 28.8% above the 2026 estimate, in a range of $6.31 billion to $7.75 billion.
Three Conditions That Move the Stock
- Event contract revenue was $173 million in Q3, 20.0% of transaction revenue. If Ohio-style demands do not spread and Rothera adds non-sports and earnings contracts, the line that replaced crypto keeps growing; if state suits and taxes cut sports contracts, transaction growth falls back on options and equities alone.
- Net interest revenue was $415 million, down 9%. If the margin book and the credit card keep lifting interest income and securities lending bottoms out, revenue growth can reaccelerate; if lower short-term rates cut customer cash income further, the year-over-year decline that began in Q3 continues into Q4.
- Net deposits were $15.7 billion, a 17% annualized rate. If October’s roughly $7 billion excluding the Dell contribution holds as a monthly pace and active users stop falling, asset-based revenue picks up again; if inflows lean on one-off Trump Account money, the active customer base behind trading revenue keeps shrinking.
What to Watch in the Fourth-Quarter Report
- The next numbers come with Q4 results around February 2027: the reconciliation table, event contract revenue after the Ohio exit, and what followed October’s $13 billion of deposits. Whether the release restates Q2 Adjusted EPS as $0.50 or $0.55 will show how the company settled the tax line.
- One question remains open. Most of Q3’s revenue gain came from event contracts filling the crypto hole, and in the same quarter the company launched a new adjusted earnings measure with two different numbers. If state regulators start to box in event contracts, what keeps Robinhood’s 21% TTM revenue growth intact?
Related Analysis
- CrowdStrike (CRWD) Stock Analysis: GAAP vs Non-GAAP Results: another company where the gap between GAAP and adjusted earnings is the story, useful for comparing how each defines its adjustments.
- Bitmine (BMNR) Stock Analysis: mNAV Below 1 and Dilution: a crypto-linked stock, a direct comparison with the crypto revenue that fell 55% at Robinhood.
- American Express (AXP) Stock Analysis: Credit Metrics Reset: a card issuer’s credit metrics, useful context for the credit loss provision that nearly tripled as Robinhood’s card book grew.