Bloom Energy (BE) Stock: Revenue Runs Ahead of Cash
Contents
- Bloom Energy (NYSE: BE) grew third-quarter 2026 revenue +138.1% to $1.24 billion, posted a 23.1% non-GAAP operating margin and earned $250.3 million for common stockholders. Operating cash flow in the same quarter was an outflow of $27.1 million. The gap sits in contract assets, revenue Bloom has recognized but not yet billed, which rose from $241.2 million at the end of 2025 to $858.6 million at the end of September, 3.56 times higher. What remains open is how fast earnings the company has guided up three times this year turn into cash.
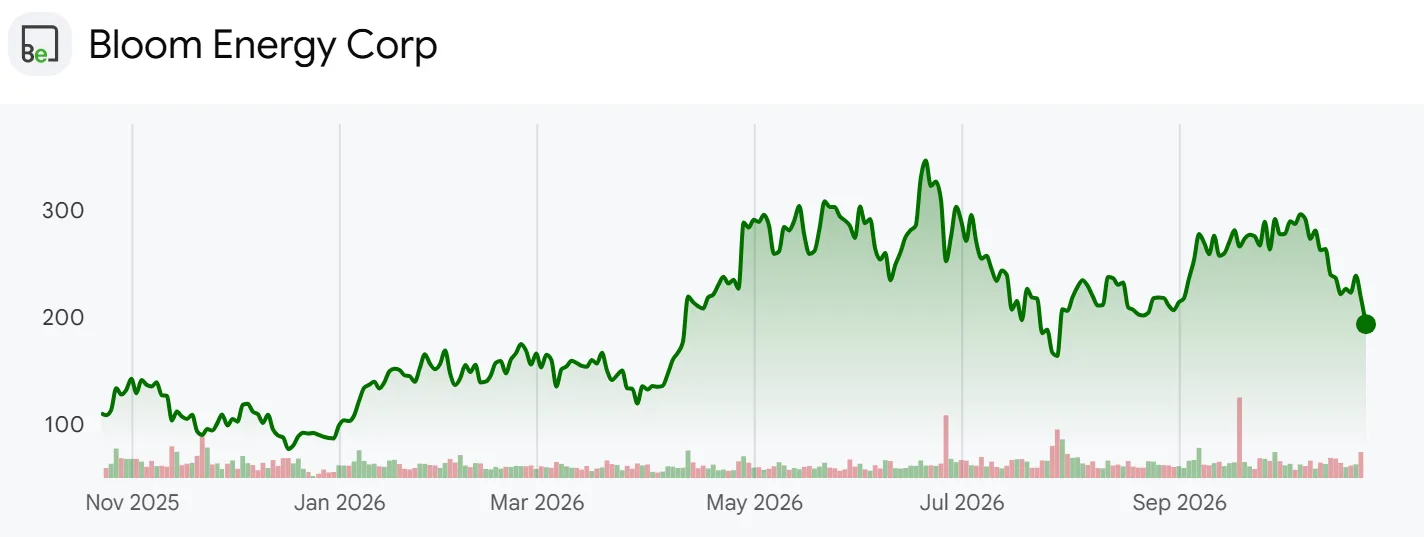
- Bloom makes solid oxide fuel cell power plants that turn natural gas, biogas or hydrogen into electricity without burning it, and sells them as on-site generation to data centers that cannot wait for a grid connection. At $193.30 a share the company is worth $57.15 billion. The stock is +122.5% in 2026 but -36.1% from its June month-end close of $302.70, and it fell -11.24% on the trading day after results. The analysis lines up 15 quarterly releases with quarterly cash flow from the filed statements and checks them against the third-quarter earnings release, the 10-Q, the 2025 10-K, four quarterly IR decks and the call remarks. Third-quarter diluted weighted shares were 324.3 million, 10.0% more than basic shares, because of convertible notes. The P/E uses trailing twelve-month (TTM) non-GAAP diluted EPS of $2.61; on TTM GAAP diluted EPS of $1.64 it is 117.9. Fourth-quarter figures are the full-year guidance midpoint minus the first three quarters.
What the Q3 Deck Shows About Guidance
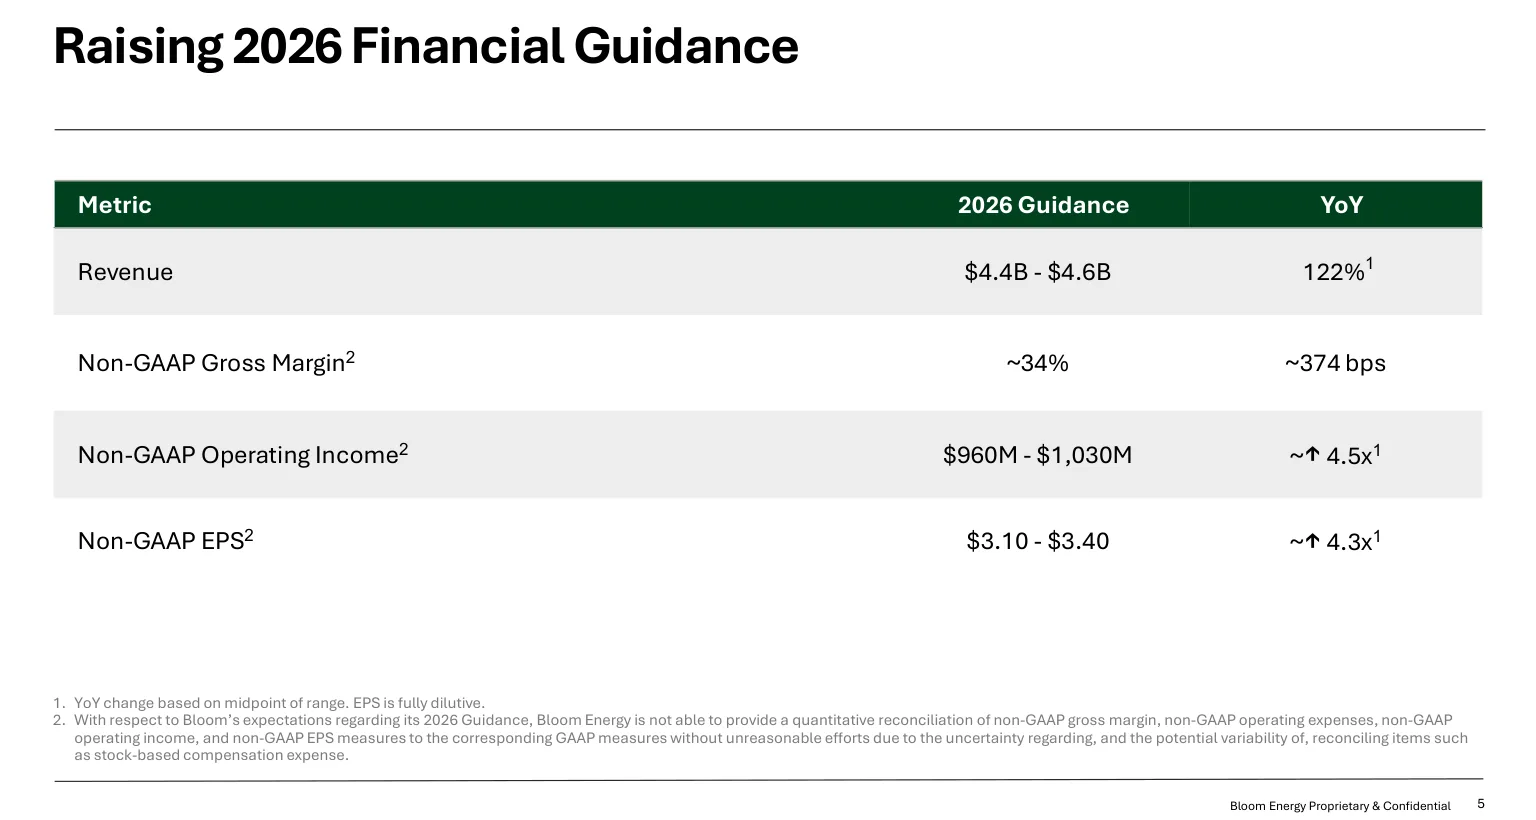
- Slide 5 of the third-quarter deck sets 2026 guidance at revenue of $4.4 billion to $4.6 billion, non-GAAP gross margin of about 34%, non-GAAP operating income of $960 million to $1,030 million and non-GAAP EPS of $3.10 to $3.40. The $4.5 billion revenue midpoint is +122% above 2025 revenue of $2.02 billion. The first guide in February was revenue of $3.1 billion to $3.3 billion, operating income of $425 million to $475 million and EPS of $1.33 to $1.48, so in eight months the revenue midpoint rose +40.6%, the operating income midpoint +121.1% and the EPS midpoint +131.3%. CFO Simon Edwards said in the release: “Our year-to-date performance and customer demand give us confidence to raise our 2026 outlook for the third time this year.”
- Slide 4 sets the third quarter beside a year earlier: revenue from $519.0 million to $1,235.8 million, non-GAAP operating income from $46.2 million to $285.7 million and non-GAAP EPS from $0.15 to $0.94. Slide 17 shows the diluted EPS math: the denominator of 324.3 million shares assumes the convertible notes turn into stock, against 294.8 million basic shares, and the numerator moves from $302.8 million of non-GAAP net income to $306.4 million.
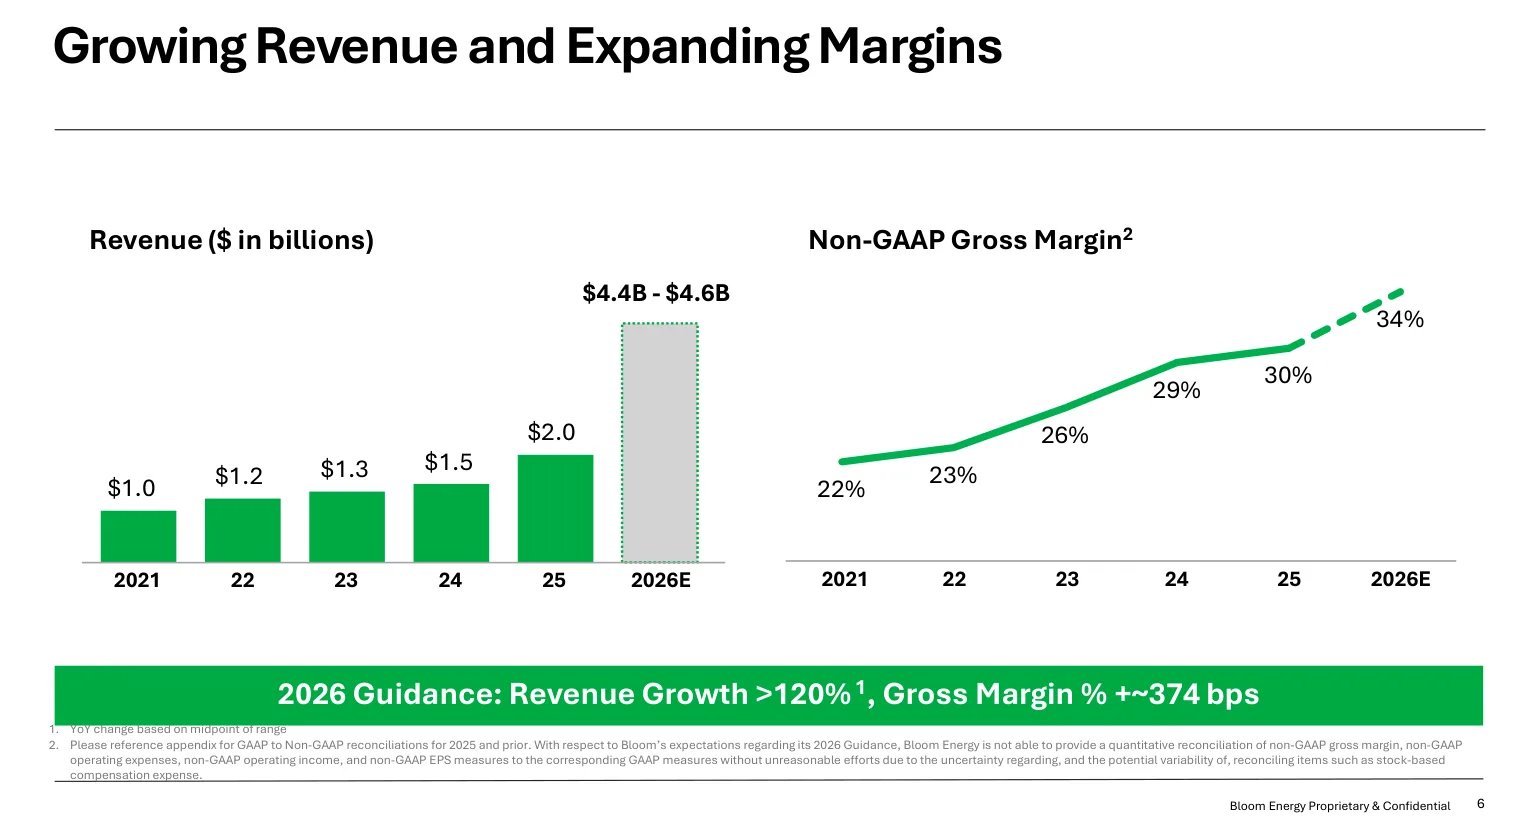
- Slide 6, titled “Growing Revenue and Expanding Margins,” draws revenue bars of $1.0 billion to $2.0 billion from 2021 to 2025 before the 2026 guide, with non-GAAP gross margin climbing from 22% to 34%. Guiding to more than double revenue with gross margin up nearly 4 points is the company’s way of saying it added volume without giving up price.
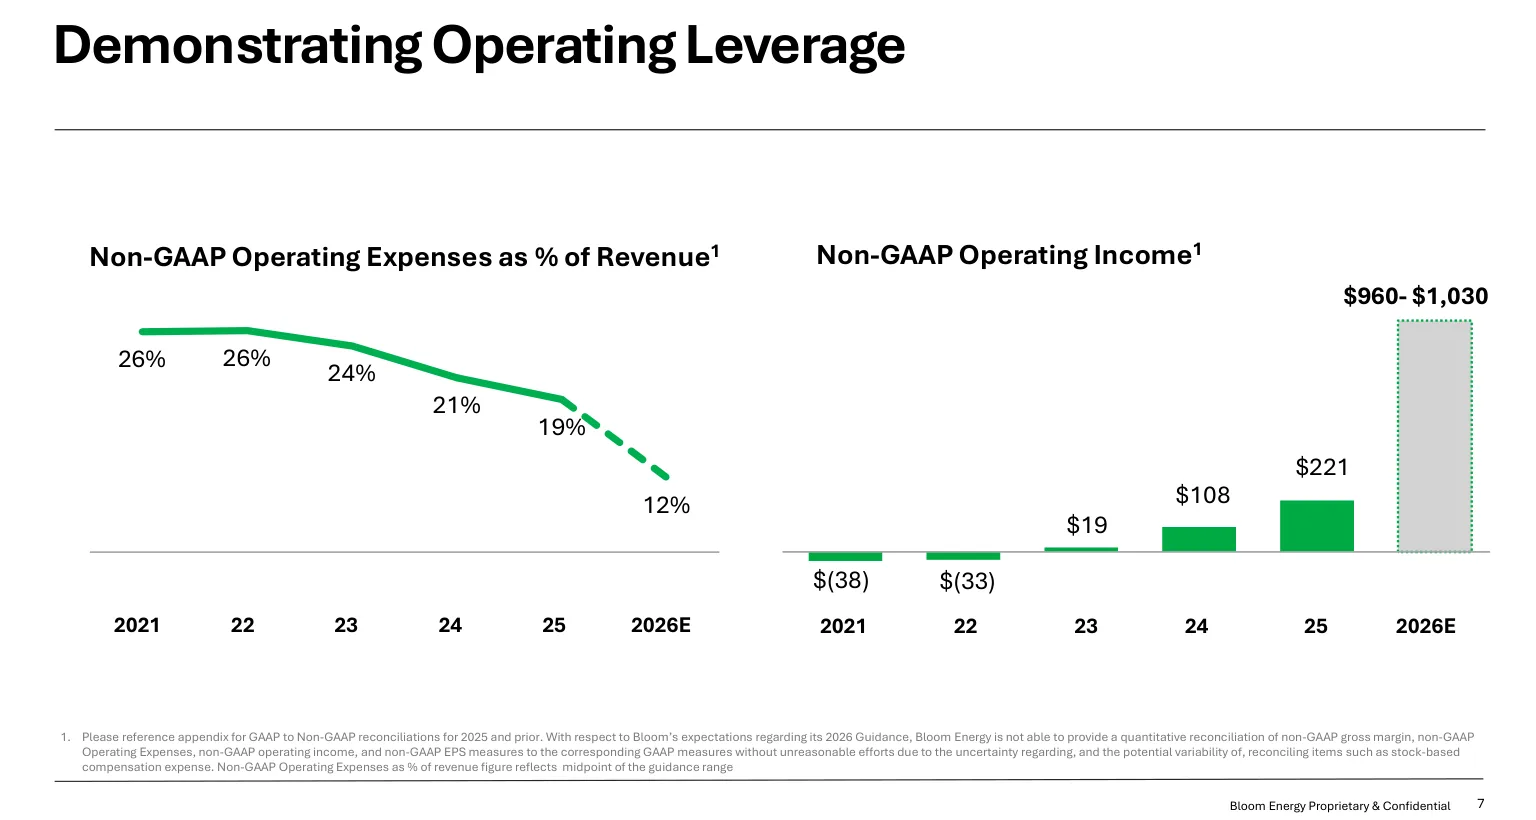
- Slide 7, “Demonstrating Operating Leverage,” shows non-GAAP operating expenses falling from 26% of revenue to 19% in 2025 and 12% at the 2026 midpoint, and non-GAAP operating income moving from a $38 million loss in 2021 to $221 million in 2025. In the third quarter revenue rose +138.1% while non-GAAP operating expenses rose +26.2%.
- Company disclosure (third-quarter call remarks): Product revenue passed $1 billion for the first time, 87% of the total, and is recognized when control passes to the customer. The outlook is built in two layers: backlog assessed customer by customer for site readiness and conversion timing, and a probability-weighted view of pipeline customers who need power within the quarter. The timing of a few shipments around year-end will decide where the company lands in the range.
- Own calculation (implied fourth quarter): Subtracting $3,052.3 million of revenue for the first three quarters from the $4.5 billion midpoint leaves $1,447.7 million for the fourth quarter, up 86.2% year over year. The same method gives fourth-quarter non-GAAP operating income of $340.0 million and EPS of $1.09. Unsatisfied performance obligations for product and installation in the 10-Q were $661.2 million, 45.7% of that implied quarter.
The Cash Flow Slide That Disappeared
- Slide 10 of the fourth-quarter 2025 deck, published in February 2026, carried the title “Driving Profitability and Generating Cash.” Operating cash flow bars ran from -$61 million in 2021 through -$192 million and -$372 million to $92 million in 2024 and $114 million in 2025, with a 2026 bar marked $200 million. Slide 8 of the April deck kept the layout, raised adjusted EBITDA guidance from $475 million to $525 million up to $650 million to $800 million, and relabeled the cash bar as more than $200 million.
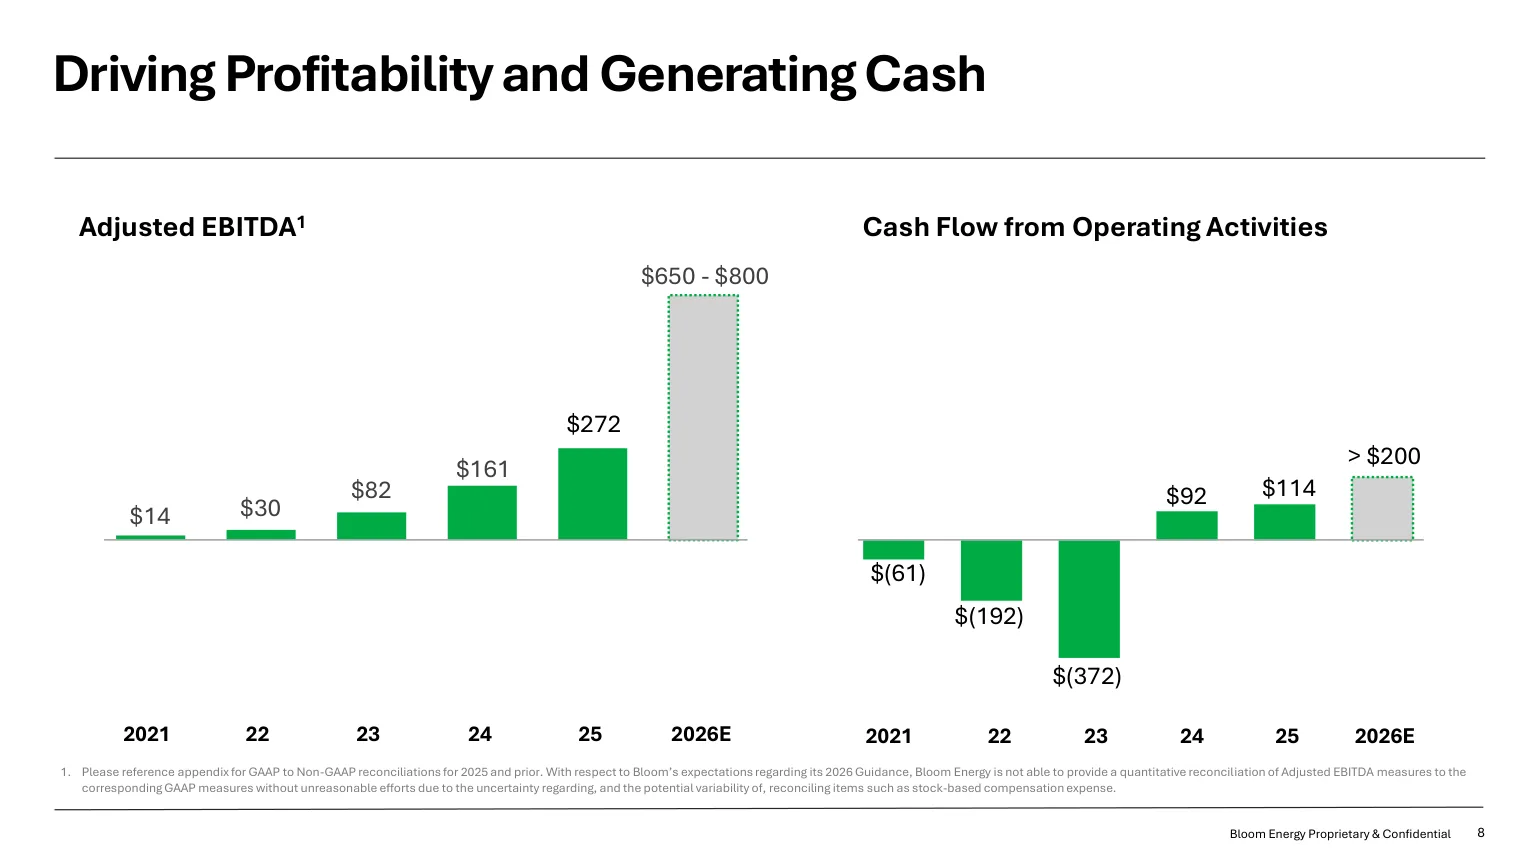
- The second-quarter deck in July and the third-quarter deck in October run 19 pages each. Neither has that slide, and the word cash does not appear in either one. Over the same stretch the revenue guidance midpoint rose from $3.2 billion to $4.5 billion and the non-GAAP operating income midpoint from $450 million to $995 million. The April adjusted EBITDA range is also gone from the third-quarter deck.
- Checked against the numbers, the cash target has already been met. Operating cash flow for the first nine months was $272.9 million, above February’s $200 million, and 8.9% of revenue against the 6.2% that February’s target implied. What stands out is that the company raised profit guidance three times without updating the cash target and then dropped the slide; profit guidance more than doubled while the cash goal sat at $200 million and then vanished. On the call Edwards said third-quarter operating cash flow was a $27 million use, with net income offset by growth in inventory, contract assets and receivables.
- Company disclosure (third-quarter call remarks): Billing follows contract milestones and can fall in a different quarter, so cash collection can lag revenue recognition, and the difference sits in contract assets and receivables until collected. The timing of large shipments and collections varies by quarter and evens out over time. Third-quarter free cash flow was a $181 million use, year-to-date free cash flow was $42 million positive, and the quarter ended with $2.5 billion of cash.
The Bull and Bear Case for Bloom Shares
- The bull case rests on the pace of earnings. Third-quarter non-GAAP operating income of $285.7 million exceeded the $221 million Bloom earned in all of 2025, and non-GAAP EPS beat consensus by 39% to 242% in each of the last four quarters. The 10-K notes that generator interconnection queues “at the end of 2024 totaled 2,300 gigawatts,” and CEO KR Sridhar said in the release: “What began with hyperscalers is rapidly moving across market segments because every business needs reliable power to grow.”
- The bear case rests on the path from earnings to cash. Third-quarter net income exceeded operating cash flow by $276.1 million, with $954.0 million tied up in contract assets, receivables, inventory and vendor advances. Brookfield joint ventures in which Bloom holds equity bought 26.0% of third-quarter revenue, and $306.5 million of share value given to Oracle will be deducted from future revenue. In July a short-seller report questioned the supply chain and the stock fell -32.0% that month. The 10-Q says: “We rejected the report’s conclusions regarding our supply chain.”
From a Revenue Restatement to AI Data Center Power
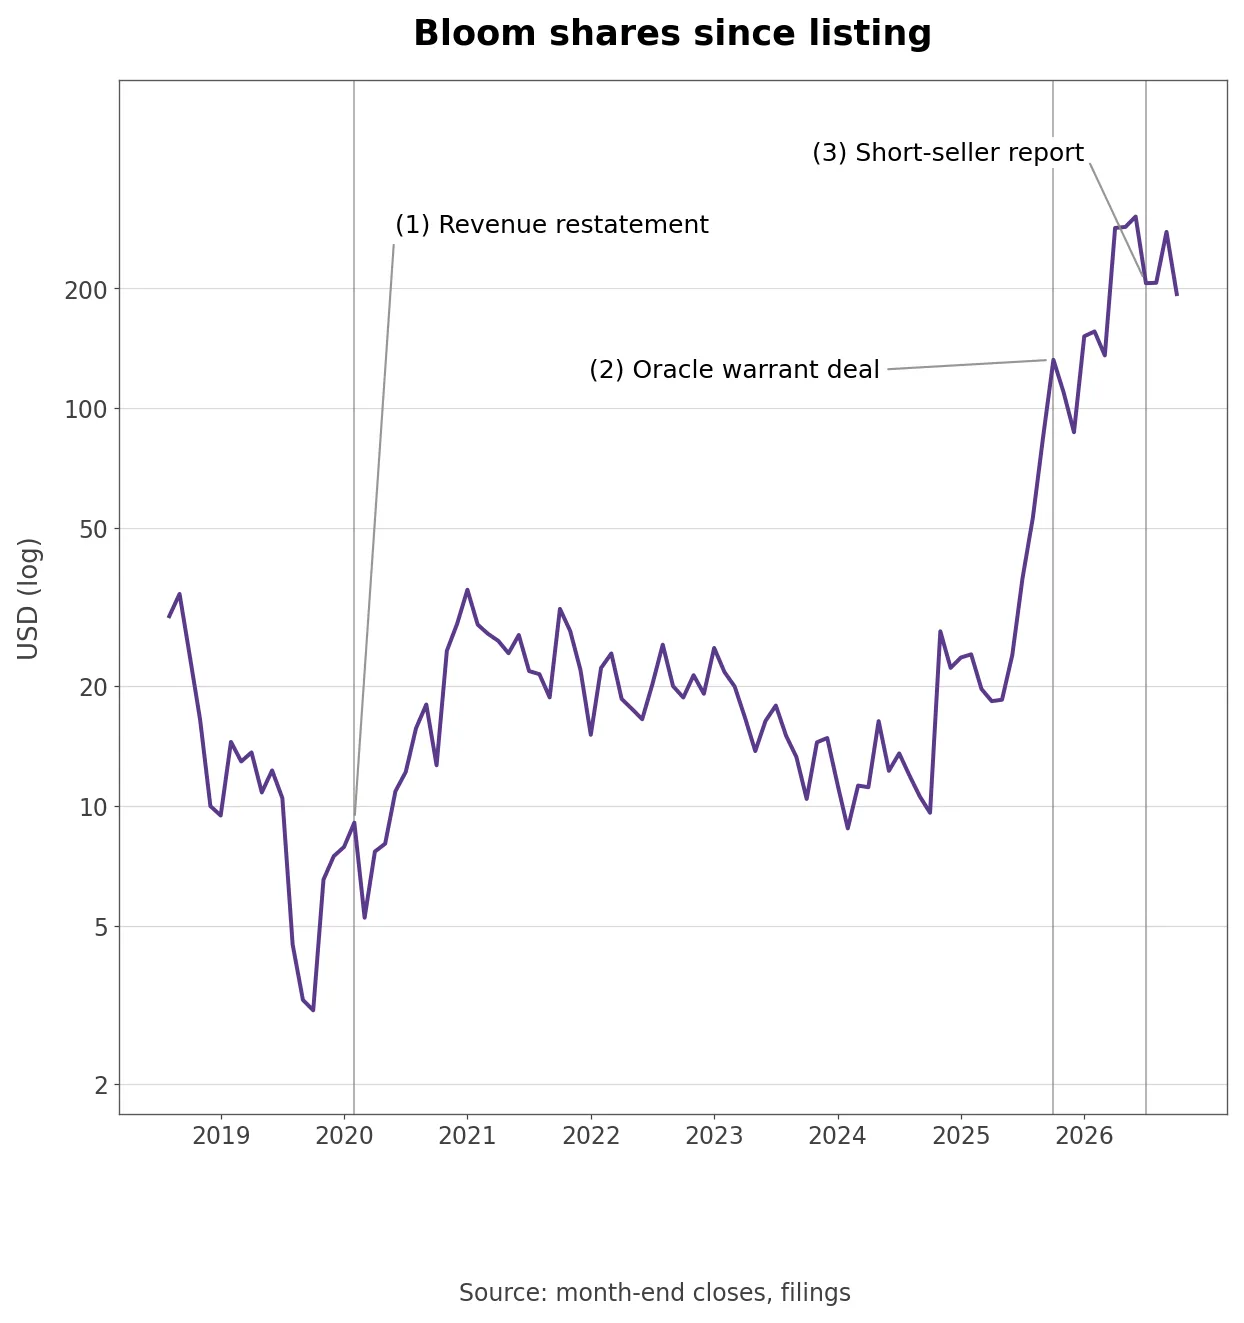
- Bloom was founded in 2001 and listed in 2018. Its first month-end close of $29.95 in August 2018 fell to $3.06 by October 2019. In February 2020 the audit committee said the 2018 annual statements and the 2018 and 2019 quarterly statements should no longer be relied upon: revenue from servers sold under managed services agreements had been booked upfront at installation, but should have been treated as financing transactions “in which revenue is recognized over the life of the Impacted MSAs.” The restatement cut revenue by $165 million to $180 million without affecting cash. When to recognize revenue was the first test of Bloom’s public life.
- From 2021 to 2024 Bloom posted revenue of $972.2 million to $1.47 billion a year and its month-end close stayed between $8.77 and $34.91. In November 2024 utility AEP agreed to buy up to 1 gigawatt of fuel cells, in August 2025 Bloom set up a financing structure with Brookfield, and in October 2025 it agreed to a warrant with Oracle. The stock rose +291.2% in 2025 and from the October 2019 low to June 2026 it climbed 98.9 times.
Where Did $249 Million of Q3 Profit Go?
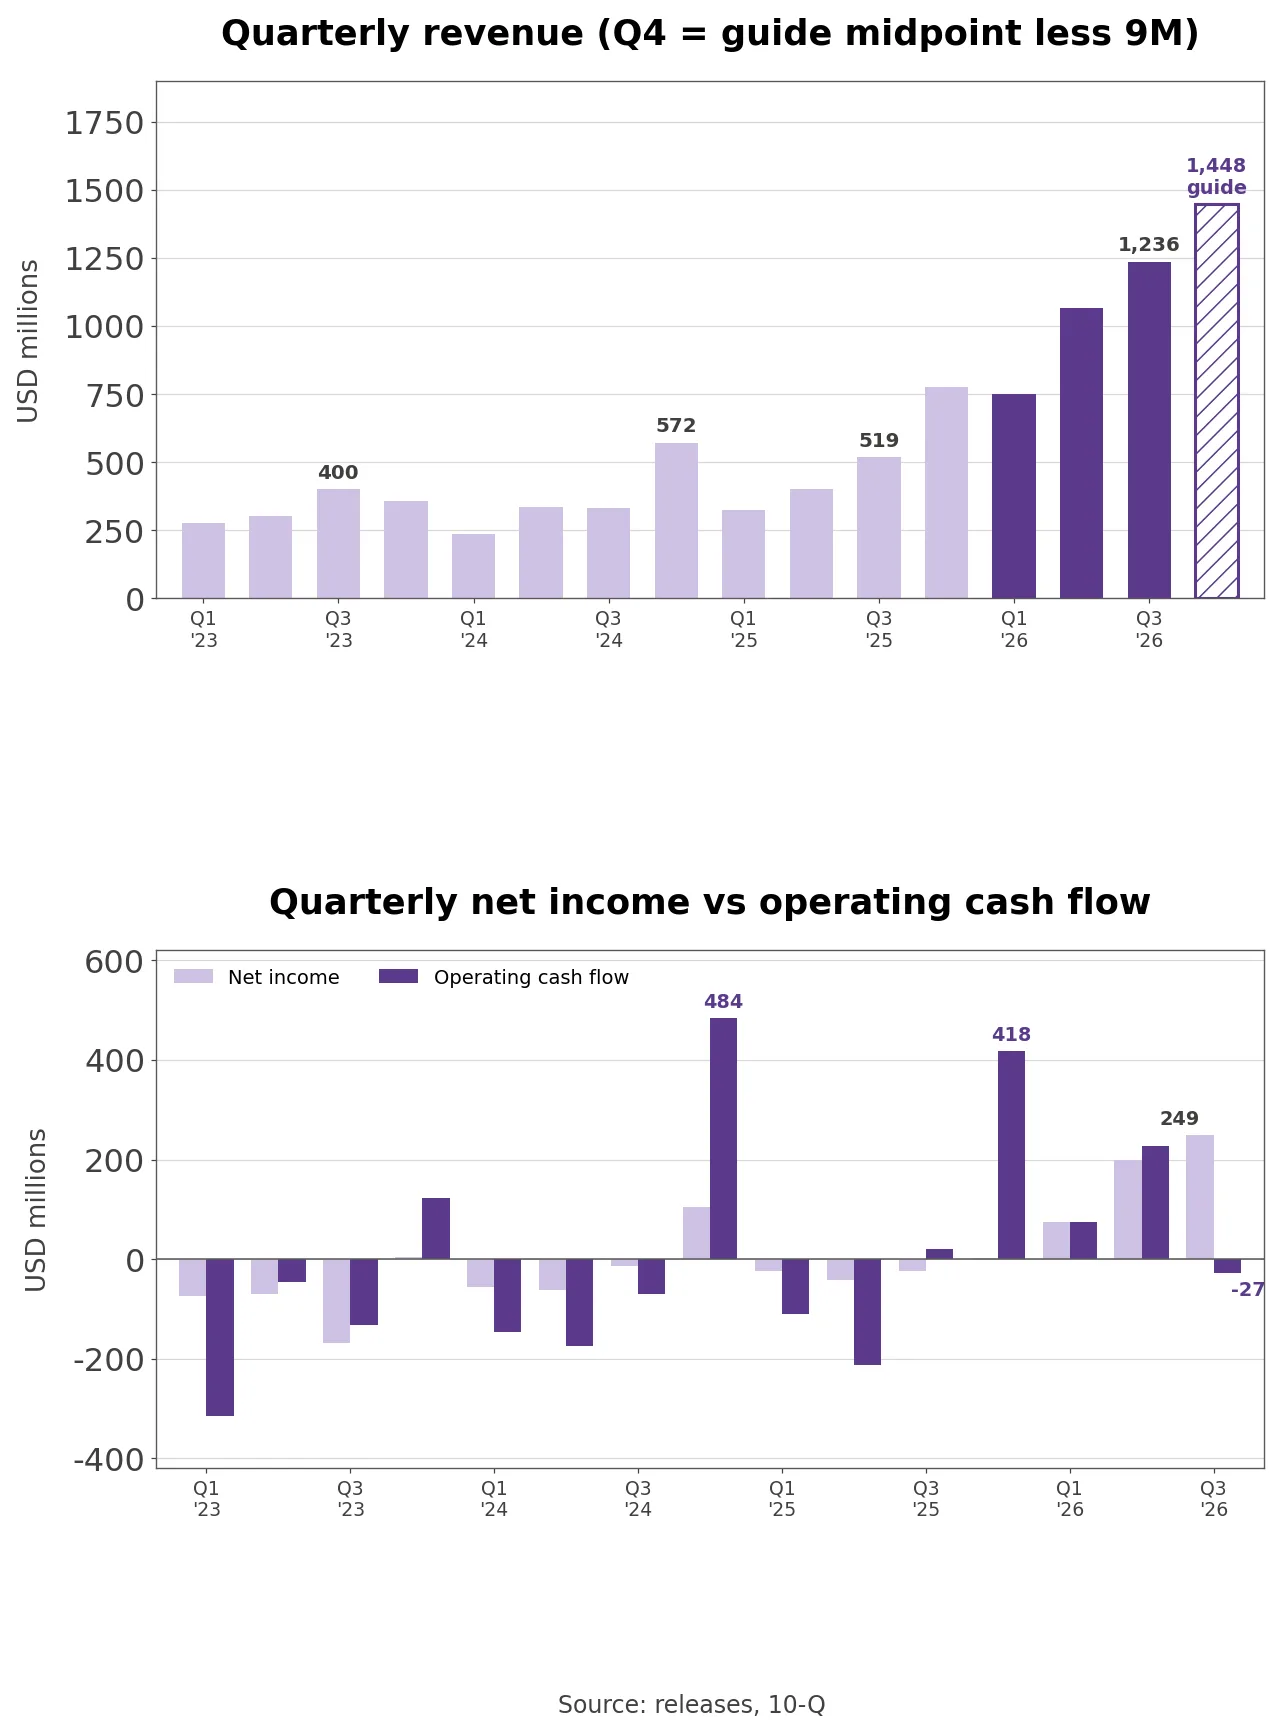
- Third-quarter net income was $249.0 million and operating cash flow a $27.1 million outflow. In the release’s cash flow statement, non-cash items including $57.2 million of stock-based compensation added $79.9 million, while increases of $430.3 million in contract assets, $175.2 million in receivables, $170.4 million in inventory and $178.0 million in other long-term assets, mostly vendor advances, absorbed cash. Those four items total $954.0 million, 77.2% of quarterly revenue. Customer deposits and deferred revenue added $309.3 million and payables and accruals $343.4 million.
- The pattern is seasonal. Bloom’s operating cash flow is weak in the first three quarters and concentrated in the fourth: in 2024 the first nine months totaled -$392.3 million before a fourth-quarter inflow of $484.2 million, and in 2025 -$304.1 million before $418.1 million. In 2026 the first nine months are already $272.9 million positive, and TTM operating cash flow of $691.0 million is 132.1% of TTM net income of $523.0 million.
- Own calculation (cash conversion): Operating cash flow covers 132.1% of net income over the latest four quarters but only 52.3% in the first nine months of 2026. Only a fourth quarter in which contract assets and receivables turn into cash, as in 2024 and 2025, would lift full-year operating cash flow above net income.
Contract Assets and Customer Deposits
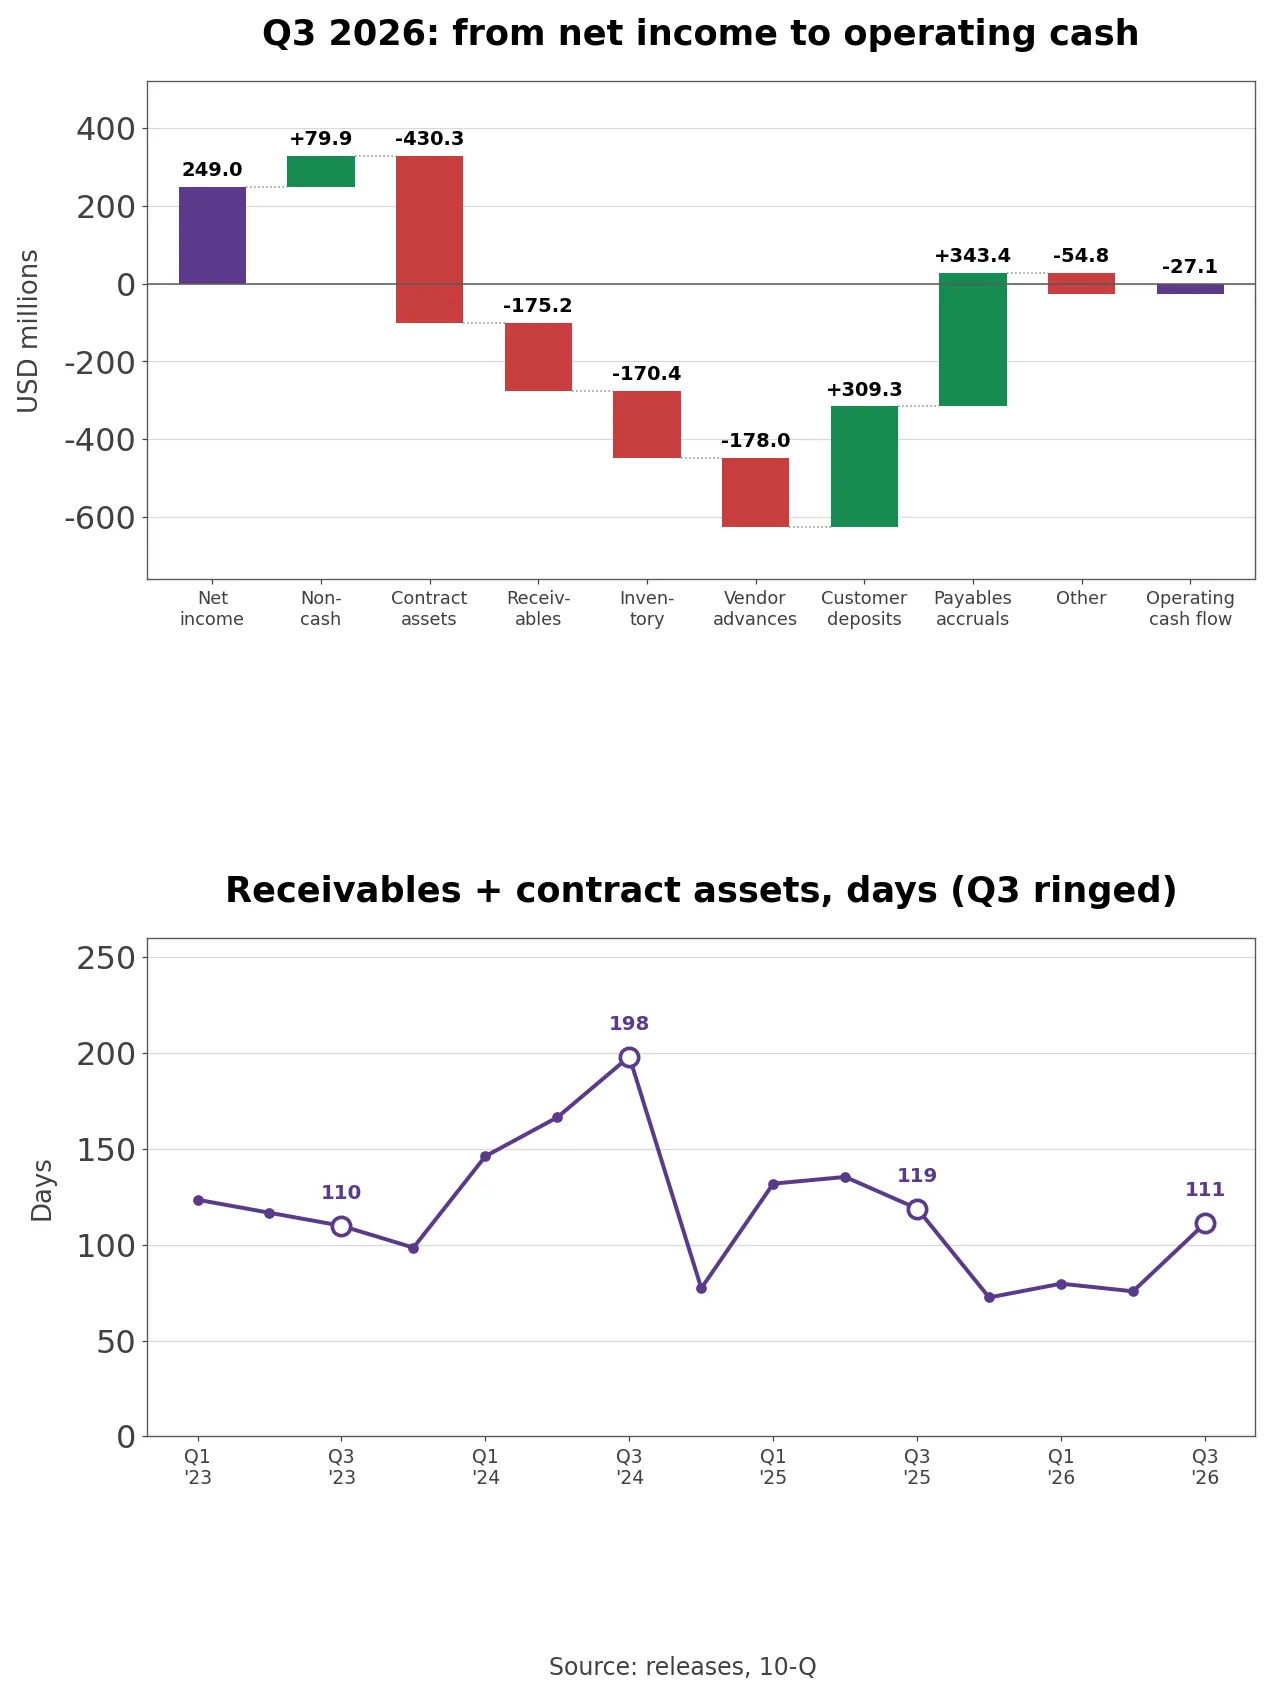
- The contract asset rollforward in the 10-Q shows that of $428.3 million at the start of the third quarter, only $33.5 million, or 7.8%, moved to receivables during the quarter. A year earlier, 24.4% did. Revenue recognized but not billed by quarter-end was $463.9 million, 37.5% of third-quarter revenue, up from 31.0%. The first critical audit matter in the 2025 10-K is the timing of product revenue recognition at customer acceptance, which depending on the contract means delivery, mechanical completion or commencement of operations. The 10-Q ties the growth in receivables and contract assets to “the timing of milestone billings and customer acceptance cycles.”
- The same 10-Q points the other way too. Customer deposits rose by $583.1 million to $661.4 million, which the company attributes to new deposits on recently signed agreements and milestone payments. Net of deposits and deferred revenue, receivables and contract assets rose by $269.8 million, just 30.6% of the $880.4 million gross increase.
- In days, the third quarter fits the seasonal pattern. Receivables plus contract assets equaled 198 days of quarterly revenue in Q3 2024, 119 in Q3 2025 and 111 in Q3 2026, and fell to 77 and 73 days in the fourth quarters of 2024 and 2025. Inventory days fell from 177 to 104. Vendor advances rose from $17.4 million to $327.0 million, advance payments to suppliers for future goods, services and equipment.
Brookfield Joint Ventures and the Oracle Warrant
- Many of Bloom’s customers are financiers that own the generators rather than the companies that use the power. The 10-K explains that “the majority of our end user customers prefer to pay for the power they will consume from our Energy Server product,” so Bloom sells servers to a financier that supplies power to the end customer. The Brookfield structure set up in August 2025 plays that role. Bloom holds 6.2% of the Bolt joint ventures inside Brookfield’s AI Infrastructure Fund, down from 9.9%, and 15.0% of ORC HoldCo, and does not consolidate them.
- Related-party revenue was $321.6 million in the third quarter, 26.0% of revenue, and 22.9% over nine months. Two customers exceeded 10% of third-quarter revenue, at 43% and 26%, the second being the related party, and related-party receivables were 30.8% of the total. Bloom’s maximum exposure to loss is listed at $63.4 million, and the decision not to consolidate the joint ventures was the second critical audit matter in the 2025 10-K.
- The Oracle relationship leaves a different mark. Tied to a partnership to supply on-site power to Oracle’s AI data centers, Bloom agreed in October 2025 to give Oracle a warrant for 3,531,073 shares at $113.28 and issued it on April 9, 2026. Oracle exercised on a cashless basis on May 1 for 1,905,433 shares, plus 248,798 inducement shares worth $72.3 million for choosing net settlement. The $323.9 million fair value is accounted for as “consideration payable to a customer’s customer” and is deducted from revenue as the Oracle servers are delivered. By September $17.3 million had been deducted, and the remaining $306.5 million equals 107.3% of third-quarter non-GAAP operating income.
How Bloom Energy Makes Money
- The 10-K lists the Energy Server for power and the Bloom Electrolyzer for hydrogen, and almost all revenue comes from the Energy Server, which converts fuel into electricity “without combustion or moving parts” and scales by adding modules. Third-quarter revenue split into product at $1,073.6 million (86.9%), installation at $84.9 million, service at $67.6 million and electricity at $9.8 million. Slide 18 of the deck shows non-GAAP gross margins of 38.4% for product, 21.4% for service, 25.7% for electricity and -3.5% for installation.
- Service contracts follow product sales. Power modules can be replaced while a server stays online, and Bloom earns service revenue from long-term maintenance agreements; service gross margin topped 20% for a second straight quarter. The deck’s risk factors list a shift toward a “consult only model particularly for large load sites.”
- The U.S. supplied 97% of third-quarter revenue. South Korea is the next-largest market, with nearly 682 megawatts deployed since 2018 through SK ecoplant and SK eternix. AEP’s 2024 agreement covers up to 1 gigawatt with an initial order of 100 megawatts, and in 2025 the top three customers accounted for 43%, 13% and 12% of revenue. Manufacturing runs in Fremont, California and Newark, Delaware; third-quarter capital spending of $153.5 million was 66.4% of the nine-month total, and Sridhar called 5 gigawatts of annual capacity a milestone on a long journey while explaining the Fremont expansion.
How Bloom Compares With Three Power Peers
- The peers sell into the same AI data center power demand. GE Vernova sells gas turbines, Vertiv sells power and cooling equipment inside data centers, and FuelCell Energy makes fuel cell plants like Bloom.
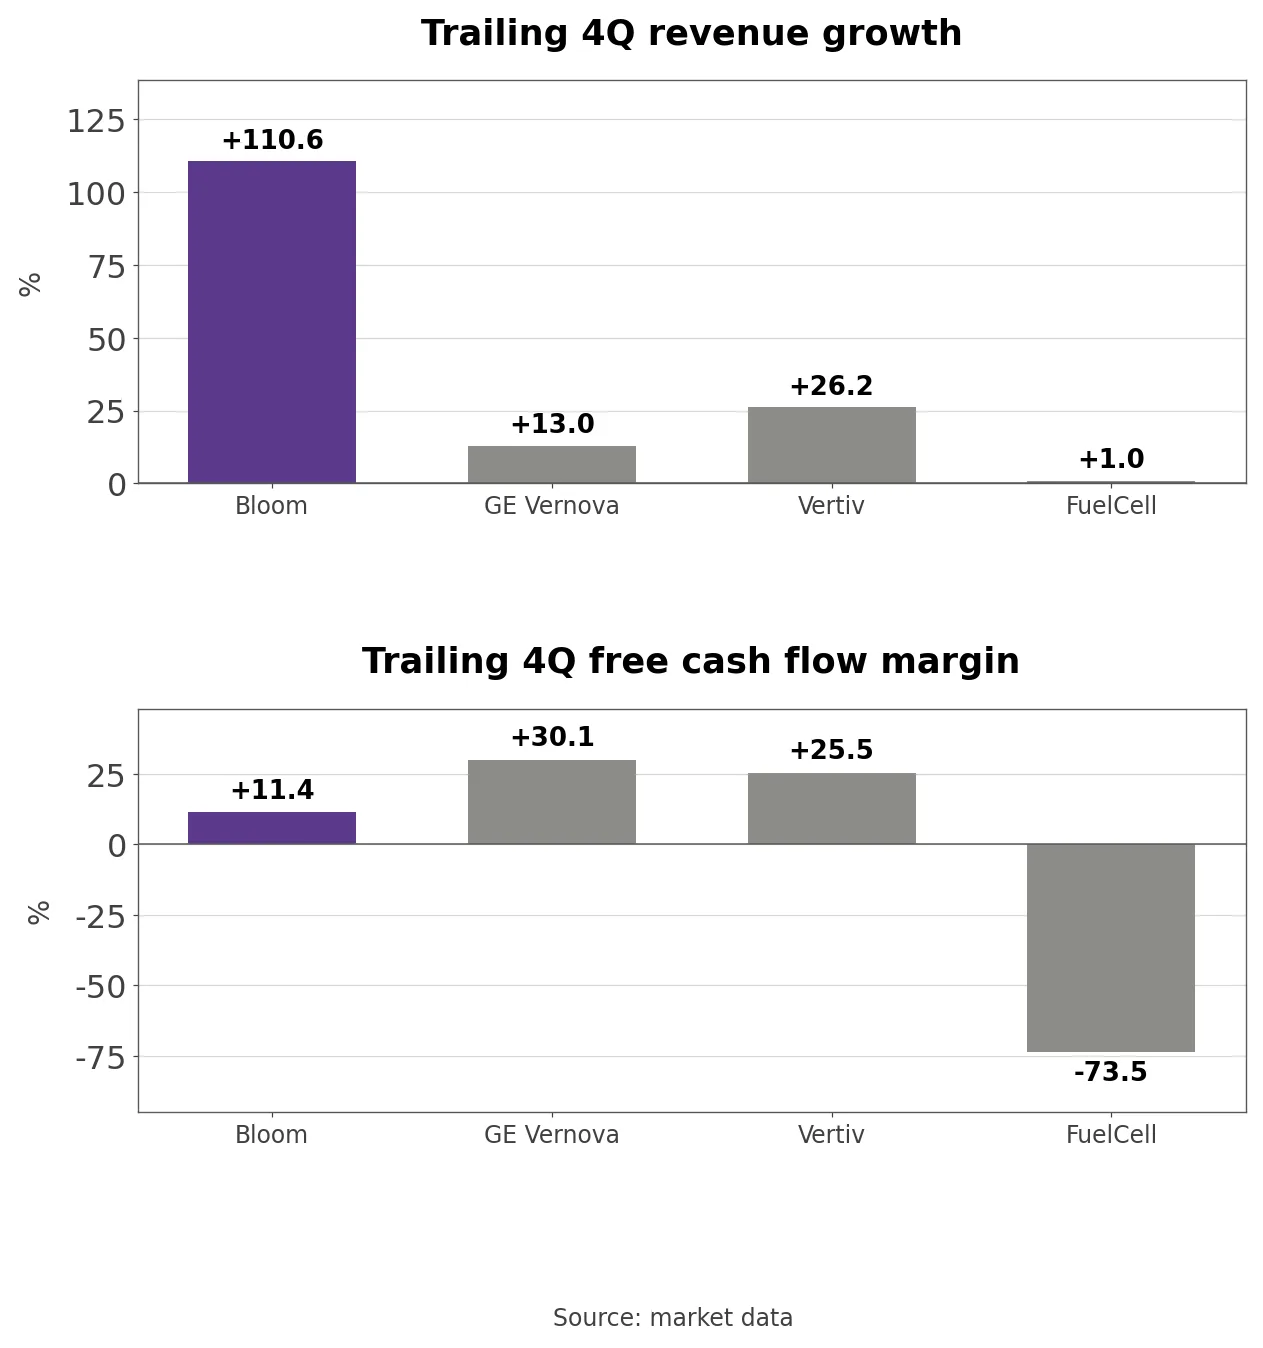
- Over each company’s latest four quarters, revenue grew +110.6% at Bloom, +26.2% at Vertiv, +13.0% at GE Vernova and +1.0% at FuelCell. Free cash flow margin reverses the order: GE Vernova 30.1%, Vertiv 25.5%, Bloom 11.4% and FuelCell -73.5%. GE Vernova’s free cash flow margin is more than four times its 6.6% operating margin, while Bloom’s sits below its 15.3% GAAP operating margin. One collects cash ahead of profit and the other after.
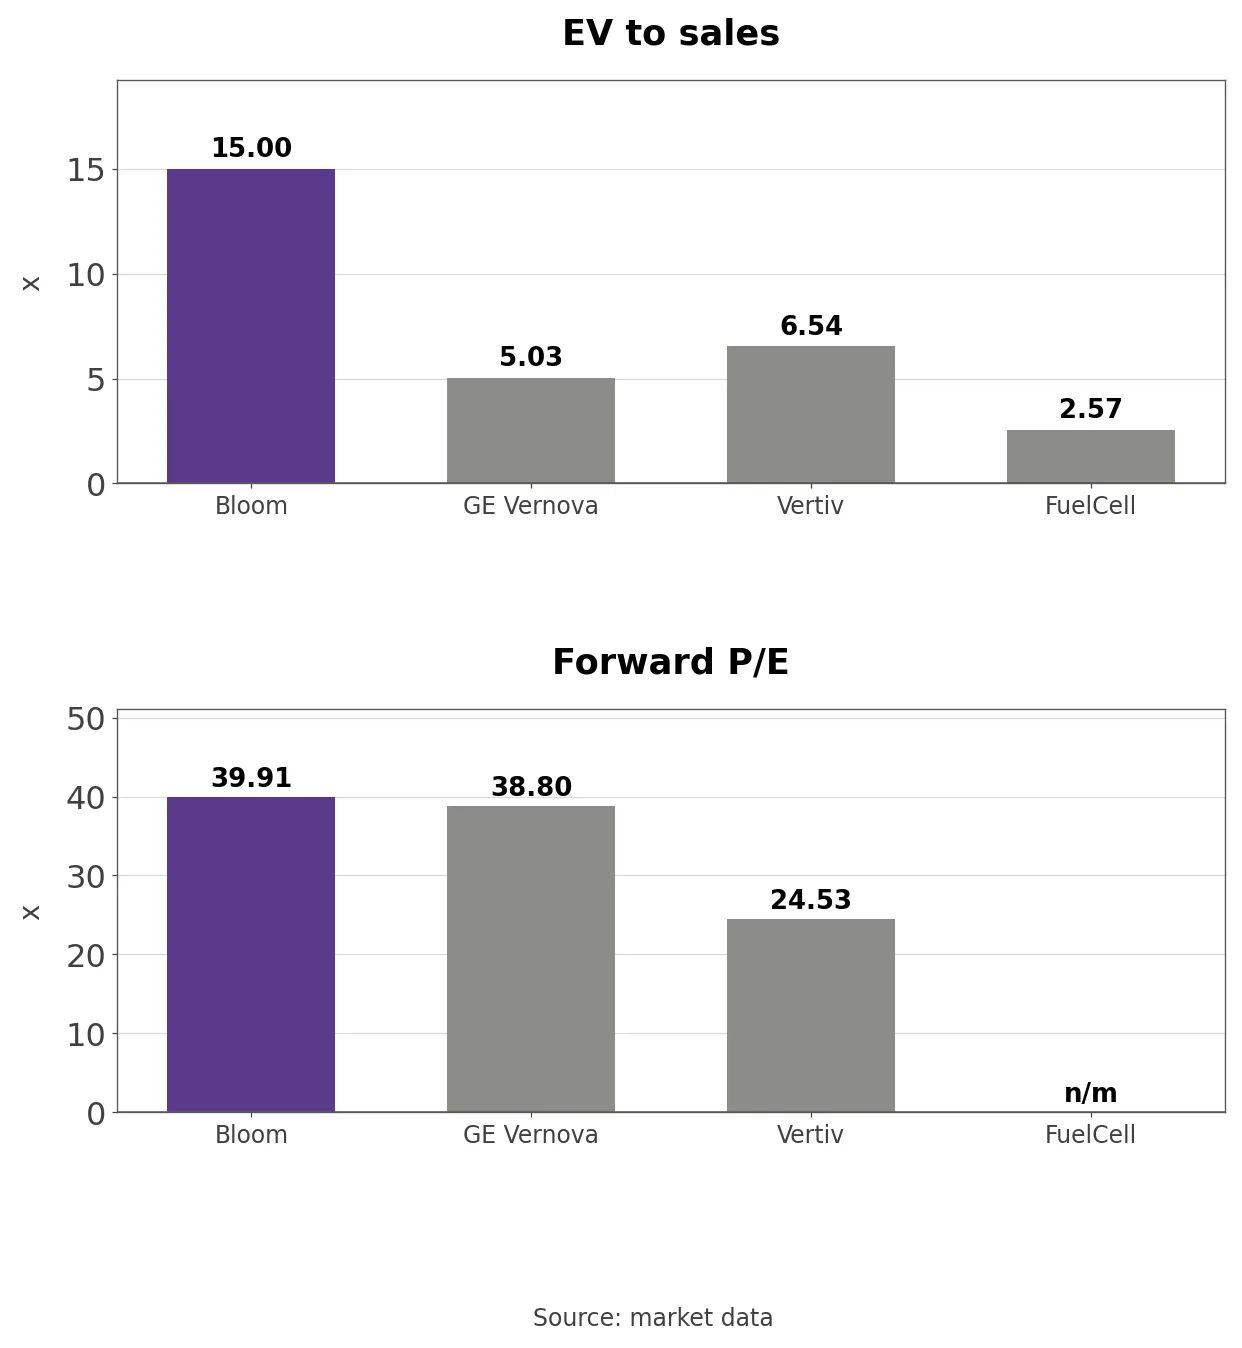
- Bloom trades at 15.00 times EV to sales against 6.54 for Vertiv, 5.03 for GE Vernova and 2.57 for FuelCell, and at 39.91 times forward earnings against 38.80 for GE Vernova and 24.53 for Vertiv; FuelCell has no earnings multiple. A sales multiple three times GE Vernova’s with a similar forward P/E means the market expects Bloom’s margins to keep rising. From their June month-end closes Bloom fell -36.1%, GE Vernova -30.6%, Vertiv -42.0% and FuelCell -69.1%, so the slide since June was a group move, with Bloom’s post-results drop on top of it.
Bloom’s P/E and Price-to-Sales Band
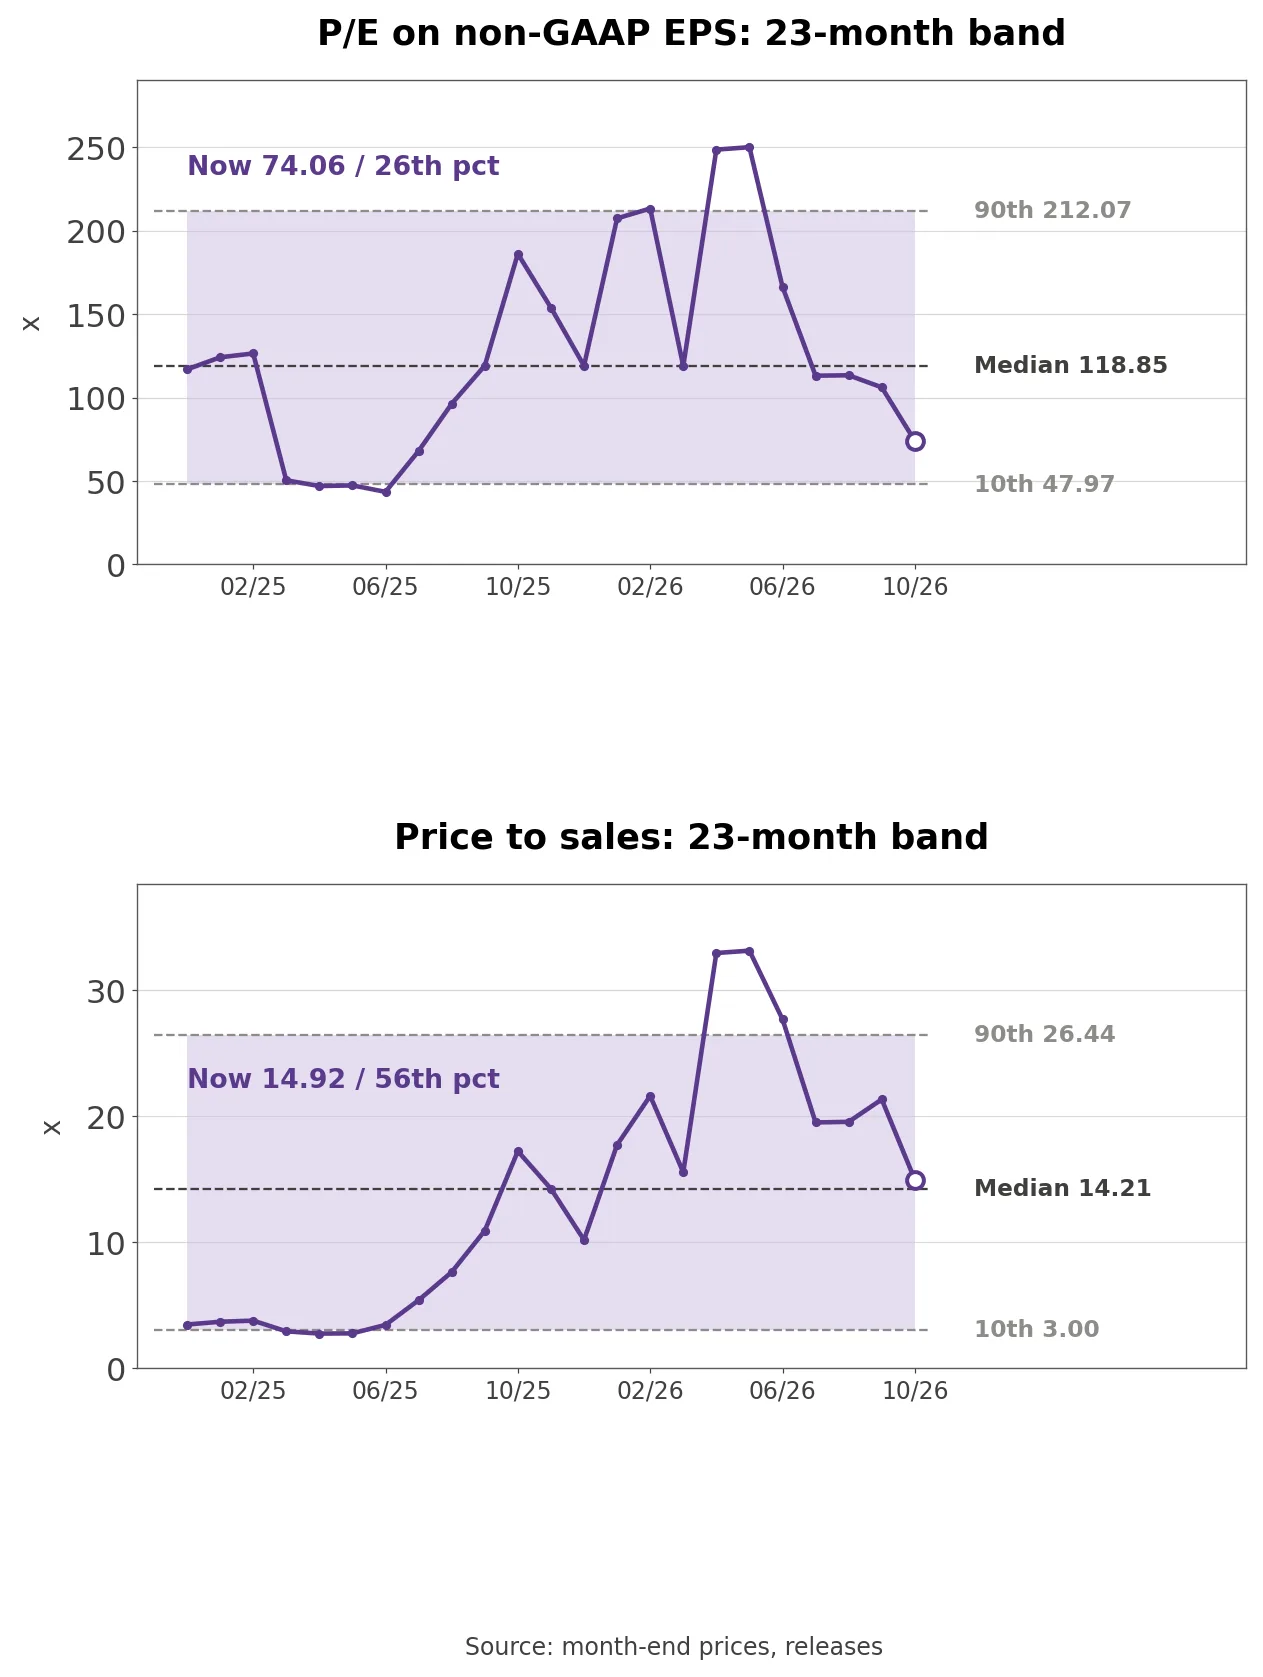
- The P/E on TTM non-GAAP EPS is 74.06, in the 26th percentile of the 23 months since December 2024, when TTM EPS first turned positive. The median is 118.85, the low 43.49 in June 2025 and the high 250.00 in May 2026. Price-to-sales is 14.92, in the 57th percentile against a median of 14.21. TTM EPS grew 13.7 times from $0.19 to $2.61 and the multiple topped 200 in four months, so the band reads more as earnings catching up with the stock than as a distribution. On the 2026 guidance midpoint of $3.25 the stock trades at 59.5 times, and on the average 2027 estimate of $5.31 at 36.4 times.
- Outside view (consensus estimates, market data): The average fourth-quarter non-GAAP EPS estimate is $1.11, close to the $1.09 implied by guidance, and the first-quarter 2027 estimate is $0.97. The average 2027 revenue estimate from 27 analysts is $7.05 billion, ranging from $5.32 billion to $8.26 billion.
Three Conditions That Move the Stock
- Operating cash flow was $272.9 million in the first nine months and a $27.1 million outflow in the third quarter. If the fourth quarter brings an inflow above $400 million and full-year cash flow exceeds net income, doubts about earnings quality fade; if contract assets keep growing and full-year cash flow falls short of net income, the view that growth ties up cash as fast as it arrives takes hold.
- Contract asset billing was 7.8% of the opening balance in the third quarter. If it moves back toward last year’s 24.4%, the build was an acceptance-timing gap; if it stays low while the balance rises, the acceptance judgment the auditor flagged becomes the issue again.
- Related-party revenue was 26.0% of third-quarter revenue. If sales outside the Brookfield joint ventures grow and the share falls, demand looks broad; if the share rises, more revenue comes from financing vehicles in which Bloom holds equity.
What to Watch in the Fourth-Quarter Report
- The next numbers are fourth-quarter operating cash flow, the contract asset rollforward and 2027 guidance in the report due around February 2027. The company set a $200 million cash flow goal in February, then dropped the slide in July and raised only revenue and profit guidance.
- One question remains open. In the third quarter 37.5% of recognized revenue was unbilled at quarter-end, and 26.0% of revenue came from joint ventures in which Bloom holds equity. If Bloom turns $858.6 million of contract assets into cash while recognizing $1.45 billion of new revenue in the fourth quarter, the earnings prove themselves; will 2027 guidance bring back a cash flow target?
Related Analysis
- Oracle (ORCL) Stock Analysis: Cash Flow and Capex Gap: the end customer behind Bloom’s warrant, useful for comparing how cash flow trails AI growth at both companies.
- Plug Power (PLUG) Stock Analysis: GAAP vs Operating Loss: a hydrogen fuel cell peer that still loses money, a contrast with Bloom’s 23.1% non-GAAP operating margin.
- NVIDIA (NVDA) Stock Analysis: Guarantees and Cash Flow: the AI accelerator leader whose data center buildout drives the power demand behind Bloom’s orders.