Coca-Cola (KO) Stock: The IRS Appeal and 1.3x Leverage
Contents
- Coca-Cola (NYSE: KO) grew unit case volume +5% in the third quarter of 2026, lifted net revenues +7.4% to $13.38 billion and raised its full-year guidance. On the same call, CFO John Murphy explained why net debt sits at 1.3 times comparable EBITDA, below the company’s own 2.0x to 2.5x target: Coca-Cola is waiting for an appeals court ruling in its transfer pricing dispute with the IRS, and he said the company is “anticipating a decision in the coming months in the IRS case.”
- Coca-Cola makes beverage concentrate and syrup, sells it to independent bottlers around the world and runs the brand marketing behind them. At $91.73 a share the company is worth $394.6 billion. The stock is +31.2% in 2026 on month-end closes, and its latest monthly close is the highest in ten years.
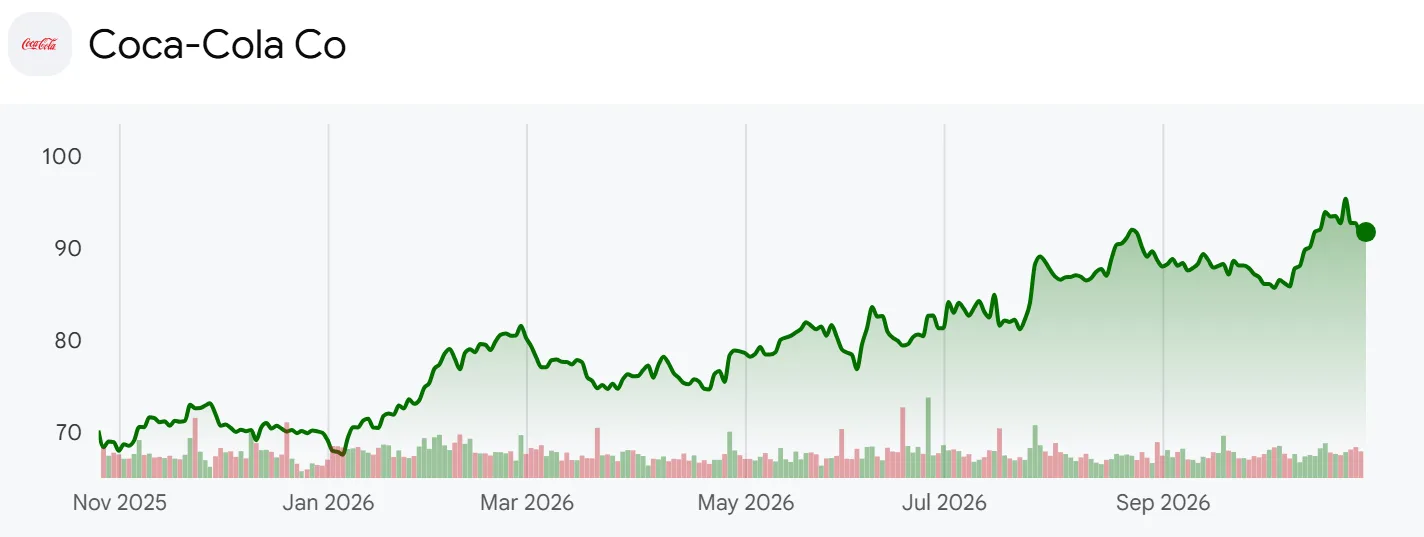
- The question here is how much money rides on a single court decision and how much of it the balance sheet room Coca-Cola has deliberately kept would cover. The analysis lines up the Q3 earnings release and the Q3 10-Q with the company’s investor decks, 32 quarterly releases and every tax disclosure since 2020.
- Two caveats apply. The trailing P/E of 26.98 uses GAAP diluted EPS of $3.40 over four quarters, including a Q4 2025 impairment on the African bottling business held for sale. The tax figures are the company’s own year-end estimates, and whether the method would reach later years depends on the courts and the IRS.
What Slide 31 Says About the IRS Case and Leverage
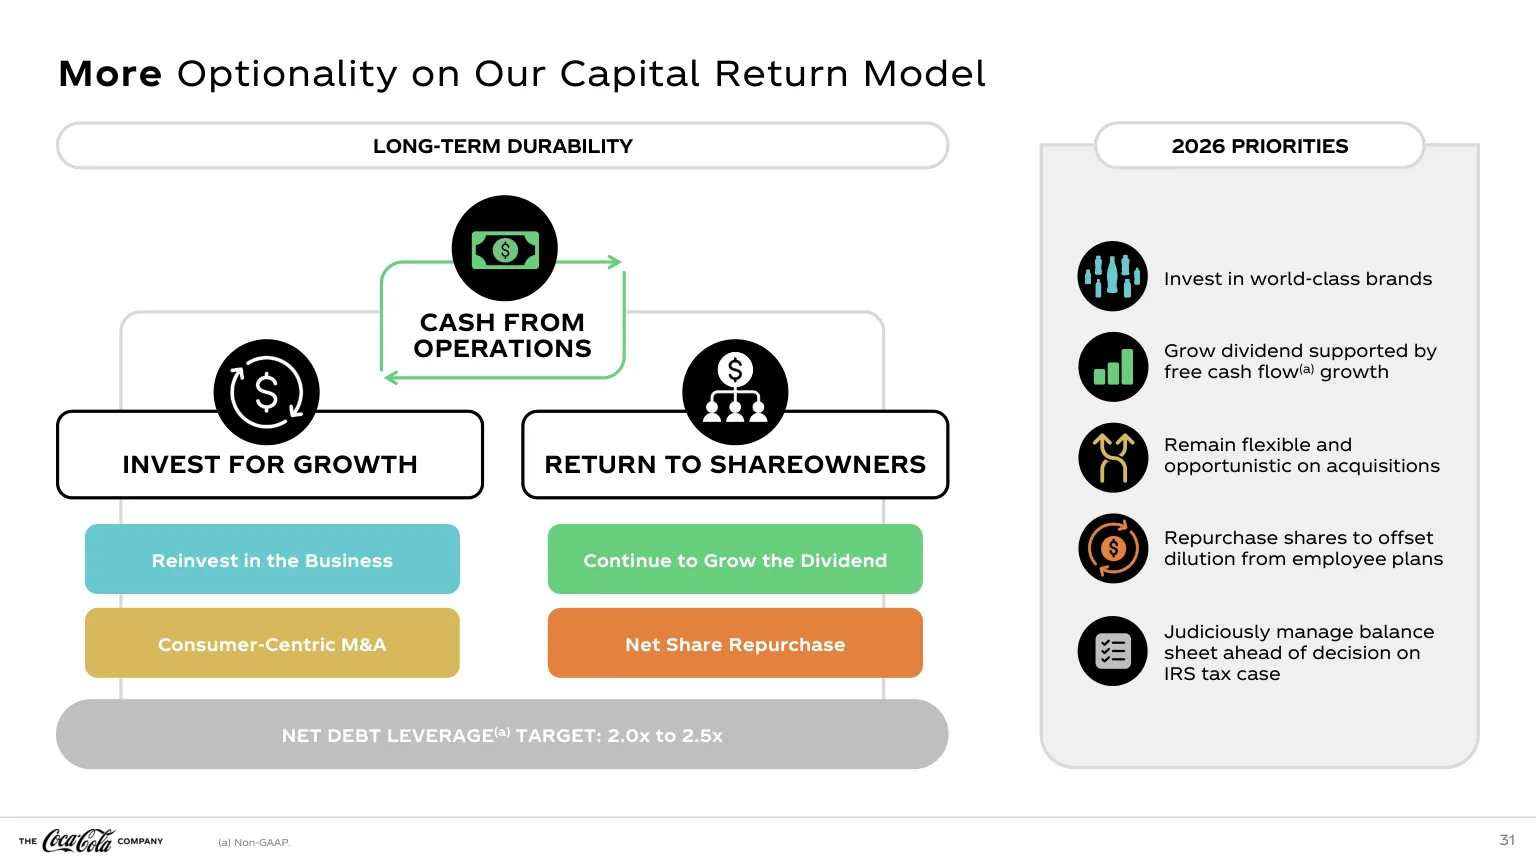
- Slide 31 of the investor overview deck sets a net debt leverage target of 2.0x to 2.5x and lists five priorities for 2026: invest in brands, grow the dividend in line with free cash flow, stay flexible on acquisitions, buy back stock only to offset employee plan dilution, and manage the balance sheet with the court case in mind. The last item reads: “Judiciously manage balance sheet ahead of decision on IRS tax case.” The buyback line no longer promises a lower share count. It promises a flat one.
- The CAGNY 2026 deck lists defending the company’s position in the IRS dispute as one of five balance sheet tasks and puts 2025 debt capacity at 2.5x leverage at $16 billion, $8 billion more than in 2015. The same slide shows a 2025 return on invested capital of 23% and says 96% of revenue now comes from outside the company-owned bottling segment. Slide 24 of the overview deck compares Coca-Cola with large consumer staples peers: average organic revenue growth since 2017 of 7% against 4%, operating margin change since 2017 of +5 points against -3 points, and ROIC of 23% against 12%.
- Company disclosure (Q3 2026 earnings call): Murphy said Coca-Cola has thought through the range of outcomes and feels ready to handle a best case and a worst case. In his words, “So the name of the game has really been to strengthen the balance sheet.” He added that capital returns, for now, will come mainly through the dividend.
- Own calculation (Q3 non-GAAP call schedules and CAGNY 2026 deck, company formula): Net debt of $25.02 billion divided by trailing comparable EBITDA of $19.51 billion gives 1.28x. Room to the bottom of the target at 2.0x is about $14.0 billion and room to the top at 2.5x is about $23.7 billion. At the end of 2025 the same figures were $6.5 billion and $15.6 billion.
- The cash flow statement matches the message. In the first nine months Coca-Cola paid $6.84 billion of dividends and bought back $900 million of stock, $545 million net of stock issuance. Diluted shares were 4.324 billion in 2017 and 4.313 billion in 2025.
What the Q3 Call Said About Pricing and Shipments
- Slide 26 of the overview deck describes the long-term growth model as organic revenue growth of 4% to 6%, built from 2% to 3% price/mix and 2% to 3% volume. It also says that in about half of the years since 1990 the beverage industry grew between 3% and 5%.
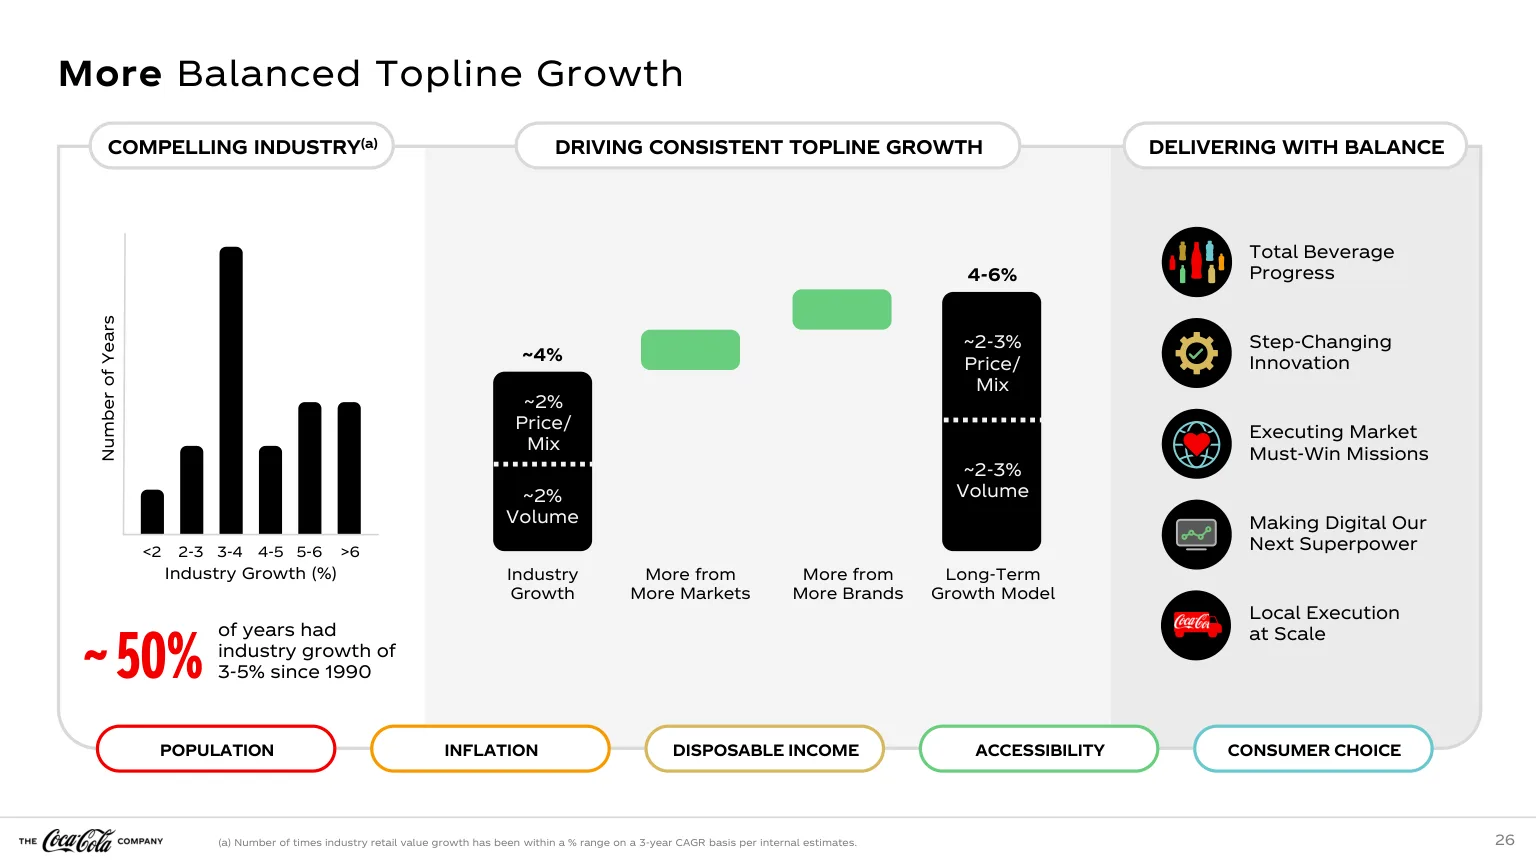
- Q3 came in on the other side of that split. Price/mix was +1%, below the model, while volume was +5%, above it. Murphy broke the price/mix figure down on the call: “This was driven by four points of pricing actions, partially offset by three points of unfavorable mix,” which he attributed to geographic mix, the timing of investments and category mix. Concentrate sales rose +7%, and the release says that “Concentrate sales were 2 points ahead of unit case volume due to the timing of concentrate shipments.”
- Margins tell a cleaner story. The Q3 margin schedule shows comparable gross margin of 62.69% against 61.03% a year earlier, a gain of 1.66 points. Strip out 0.45 points of currency and 0.28 points from last year’s sale of the Nigerian finished product business and the underlying gain is 0.93 points, which matches Murphy’s three-part explanation.
- Company disclosure (Q3 2026 earnings release): Coca-Cola raised its 2026 outlook for organic revenue growth from about 5% to at least 5%, for comparable currency neutral EPS growth excluding acquisitions and divestitures from 7% to 8% to at least 9%, for comparable EPS growth from 9% to 10% to at least 11%, and for free cash flow from about $12.4 billion to at least $13.0 billion. It also lowered its underlying effective tax rate outlook from 19.9% to 19.7%, with a footnote that reads: “This does not include the impact of ongoing tax litigation with the U.S. Internal Revenue Service, if the company were not to prevail.”
- The fourth quarter is where the timing comes back. Murphy said the quarter has six fewer days and that some segments should see slight destocking: “Therefore, we expect concentrate shipments to slightly trail unit case volume for the full year.” He also said the bottling system tends to get ahead of an unpredictable environment by building inventory. Year to date, concentrate sales are +6% against unit case volume of +4%. The sale of a portion of Coca-Cola Beverages Africa (CCBA) to Coca-Cola HBC, expected to close in Q4, should cut comparable net revenues by about 4 points in Q4 and about 8 points in 2027.
- Own calculation (nine-month release table and 2025 quarterly revenue): Weighting nine-month organic growth of 8% and the full-year floor of 5% by 2025 quarterly revenue implies Q4 organic revenue of about -4.2%, or between -2.6% and -5.7% once rounding in the nine-month figure is allowed for. The day count alone, 90 days against 96, is a 6.2% headwind.
The Bull and Bear Case for Coca-Cola Shares
- The bull case rests on breadth and balance sheet strength. Volume rose 5% to 6% in every region outside North America, management cited 22 straight quarters of global value share gains, and guidance went up. A win on appeal would return $6.6 billion and leave about $30.3 billion of room to 2.5x leverage.
- The bear case rests on the ruling and the quality of growth. A loss would put about $22.0 billion at stake, 5.6% of the market value, and lift the tax rate by about 3.8 points. Price/mix is below the long-term model, Q4 organic revenue is likely negative, and price-to-sales is at a 59-month high.
From a 2015 Tax Notice to the 2026 Appeal Hearing
- The dispute began on September 17, 2015, when the IRS sent a notice of deficiency seeking about $3.3 billion of additional federal income tax for 2007 through 2009. The IRS wanted to reallocate more than $9 billion of income from foreign affiliates licensed to make and sell Coca-Cola products back to the U.S. parent. At issue is whether the parent was paid an arm’s-length price by those licensees. Coca-Cola’s defense rests on a method it agreed with the IRS in 1996 and wrote into a closing agreement, which the IRS audited and accepted in five successive audit cycles covering 1996 through 2006 before the 2015 notice replaced it.
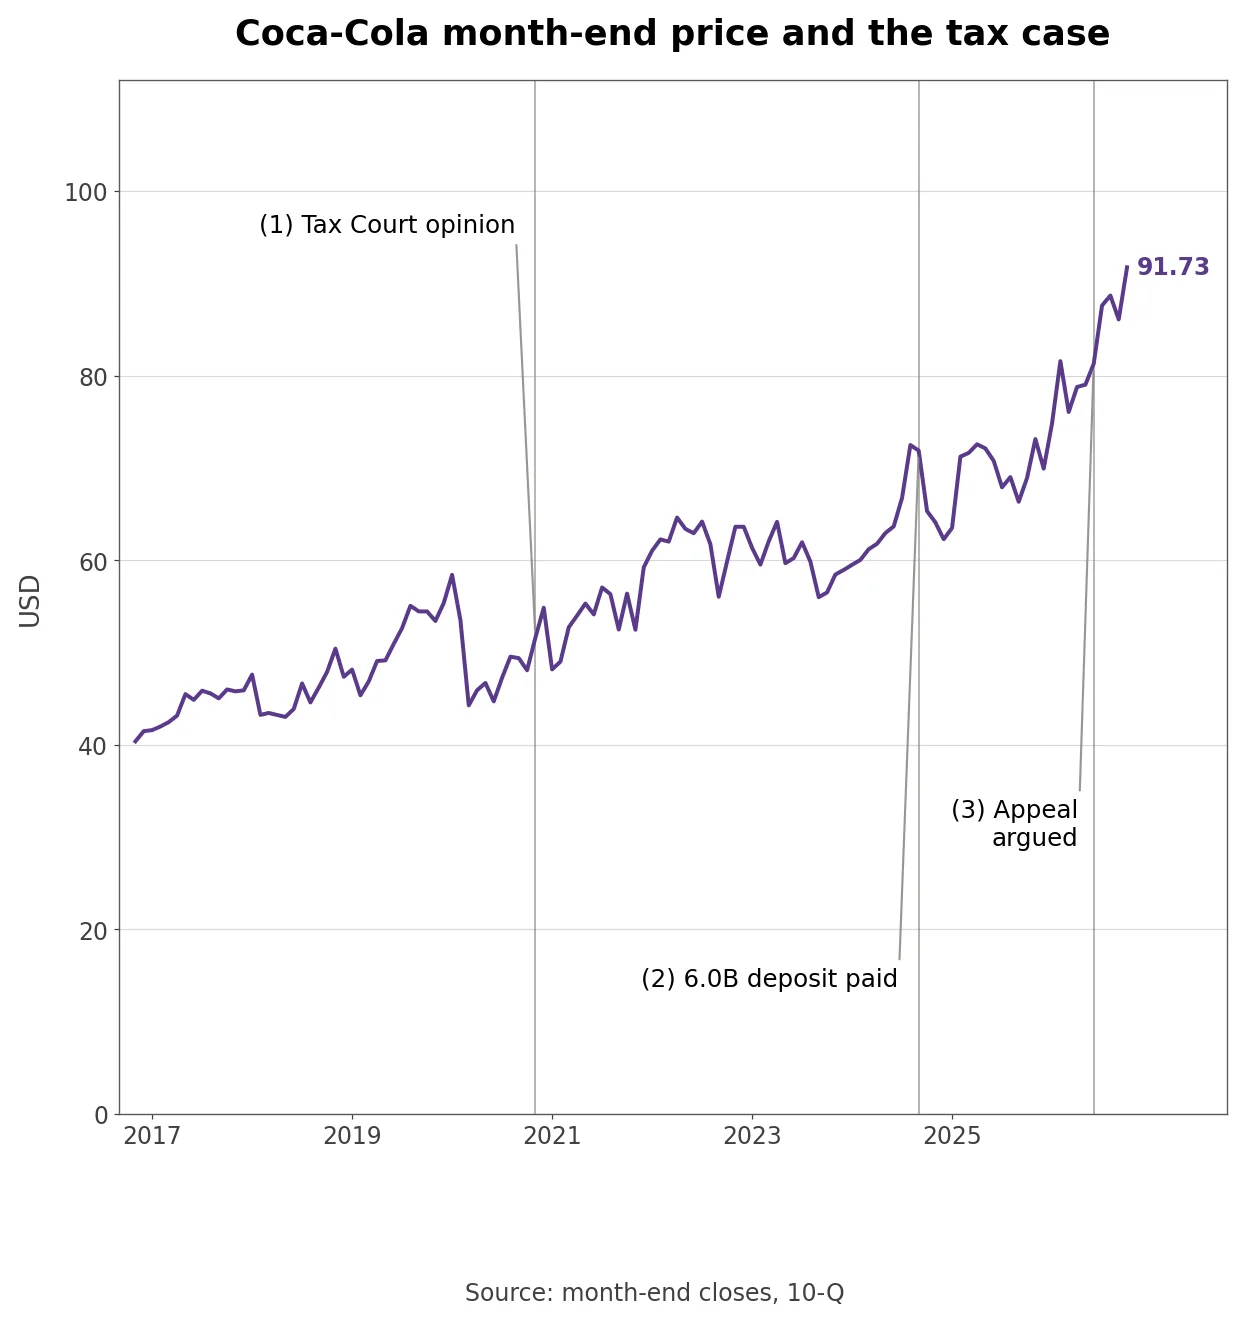
- On November 18, 2020, the Tax Court predominantly sided with the IRS, and the stock closed that month at $51.60. A supplemental opinion on November 8, 2023 also sided with the IRS on the blocked-income regulations covering royalty limits in Brazil. On August 2, 2024 the court entered a decision for $2.7 billion of additional tax for 2007 through 2009, $6.0 billion with interest, which Coca-Cola paid as a deposit on September 10, 2024 and would get back with interest if it wins.
- Coca-Cola appealed to the Eleventh Circuit on October 22, 2024, and the court heard the case on June 25, 2026. In the meantime, on October 1, 2025, the Eighth Circuit reversed the Tax Court in the 3M case and held the blocked-income regulation inconsistent with Section 482. The Q3 10-Q says: “Both of these conclusions are highly supportive of the Company’s position in its case and reinforce its prior conclusions.”
- Management changed during the wait: James Quincey moved to executive chairman on March 31, 2026 after nine years as CEO, and COO Henrique Braun took over. On the Q2 call Murphy put the timing of a ruling at six to twelve months after the hearing, and on the Q3 call he narrowed that to the coming months. Month-end closes moved from $71.86 in the deposit month to $81.27 in the hearing month and $91.73 now.
How Big Is the Tax Bill If Coca-Cola Loses?
- The estimate has grown with every annual filing. Coca-Cola’s year-end calculation of the potential liability was $12 billion for 2020, $13 billion for 2021, $14 billion for 2022 and $16 billion for 2023. After the $6.0 billion deposit for 2007 through 2009, the company began reporting only the remaining years from 2010, restated the end-2023 figure at $10 billion, and then reported $12 billion for 2024 and $14 billion for 2025. With the deposit added back, the total was $18 billion at the end of 2024 and $20 billion at the end of 2025.
- Filing note (Q3 10-Q): If the company loses, it would not receive a refund of the $6.0 billion deposit or the related accrued interest receivable of $589 million, and it “would likely be subject to significant additional liabilities for subsequent years.” The remaining incremental tax and interest for 2010 through 2025 is estimated at about $14 billion as of the end of 2025, and applying the same method in 2026 added about $450 million in Q3 and $1.4 billion in the first nine months. Continued application in 2026 would raise the effective tax rate by about 3.8 points, up from 3.5 points in the 2023 to 2025 filings.
- Own calculation (Q3 10-Q and Q3 release): Adding $6.0 billion, $589 million, $14 billion and $1.4 billion gives about $22.0 billion at stake, 5.6% of the market value, of which about $15.4 billion would be new cash going out. Applying a 23.5% tax rate instead of 19.7% to the 2026 comparable EPS floor of $3.33, which is 1.11 times the 2025 figure of $3.00, gives $3.17, a 4.8% cut.
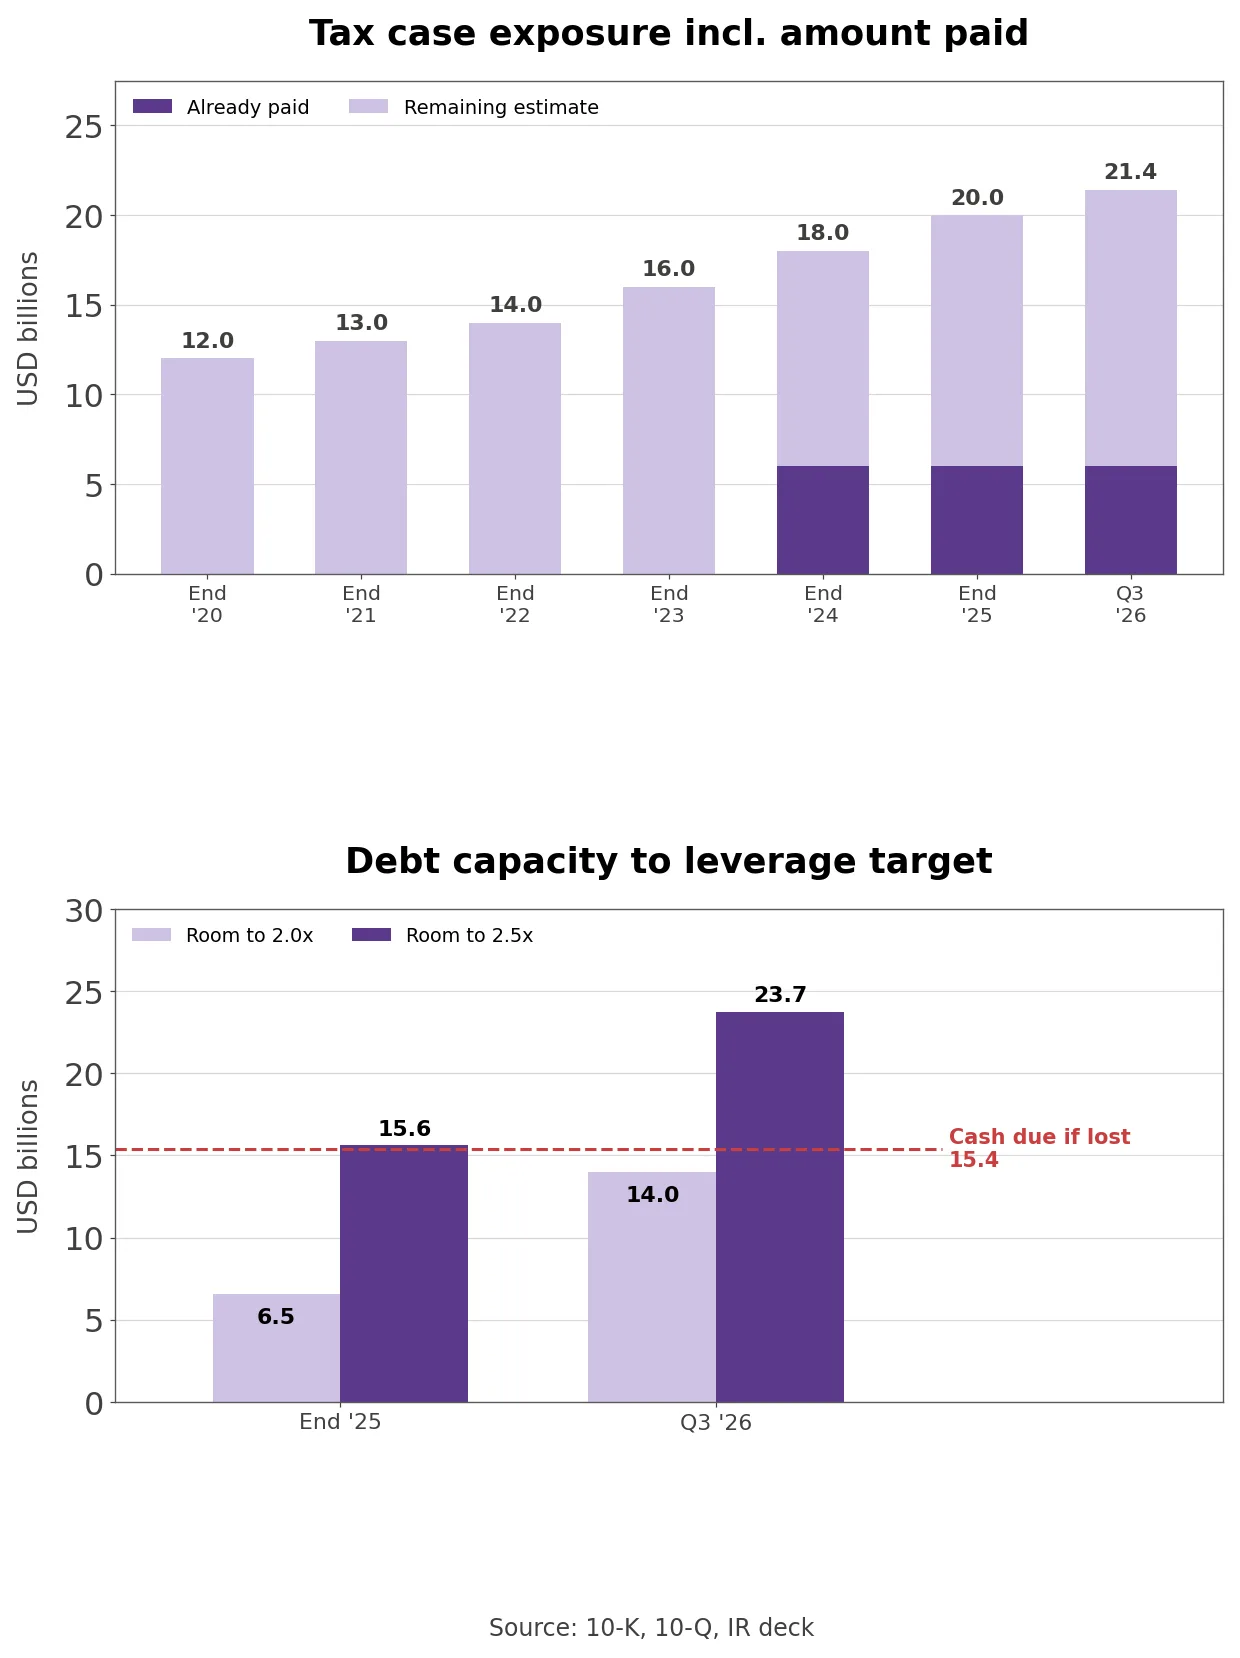
- Borrowing the full $15.4 billion would take net debt to 2.07x comparable EBITDA, near the bottom of the target range. A win would return $6.6 billion, cut leverage to 0.94x and open up about $30.3 billion of room to 2.5x, 7.7% of the market value. Room at 2.5x grew from $15.6 billion at the end of 2025 to $23.7 billion, which is why a loss would still leave leverage inside the target. The deposit also earns interest through the tax line, $155 million in the first nine months, which would stop with a loss.
Concentrate Shipments Ahead of Unit Cases
- Concentrate sales measure what Coca-Cola ships to bottlers, while unit case volume measures what bottlers sell on to customers, counted as an average per day. The gap between the two reflects bottler inventory and differences in the number of selling days.
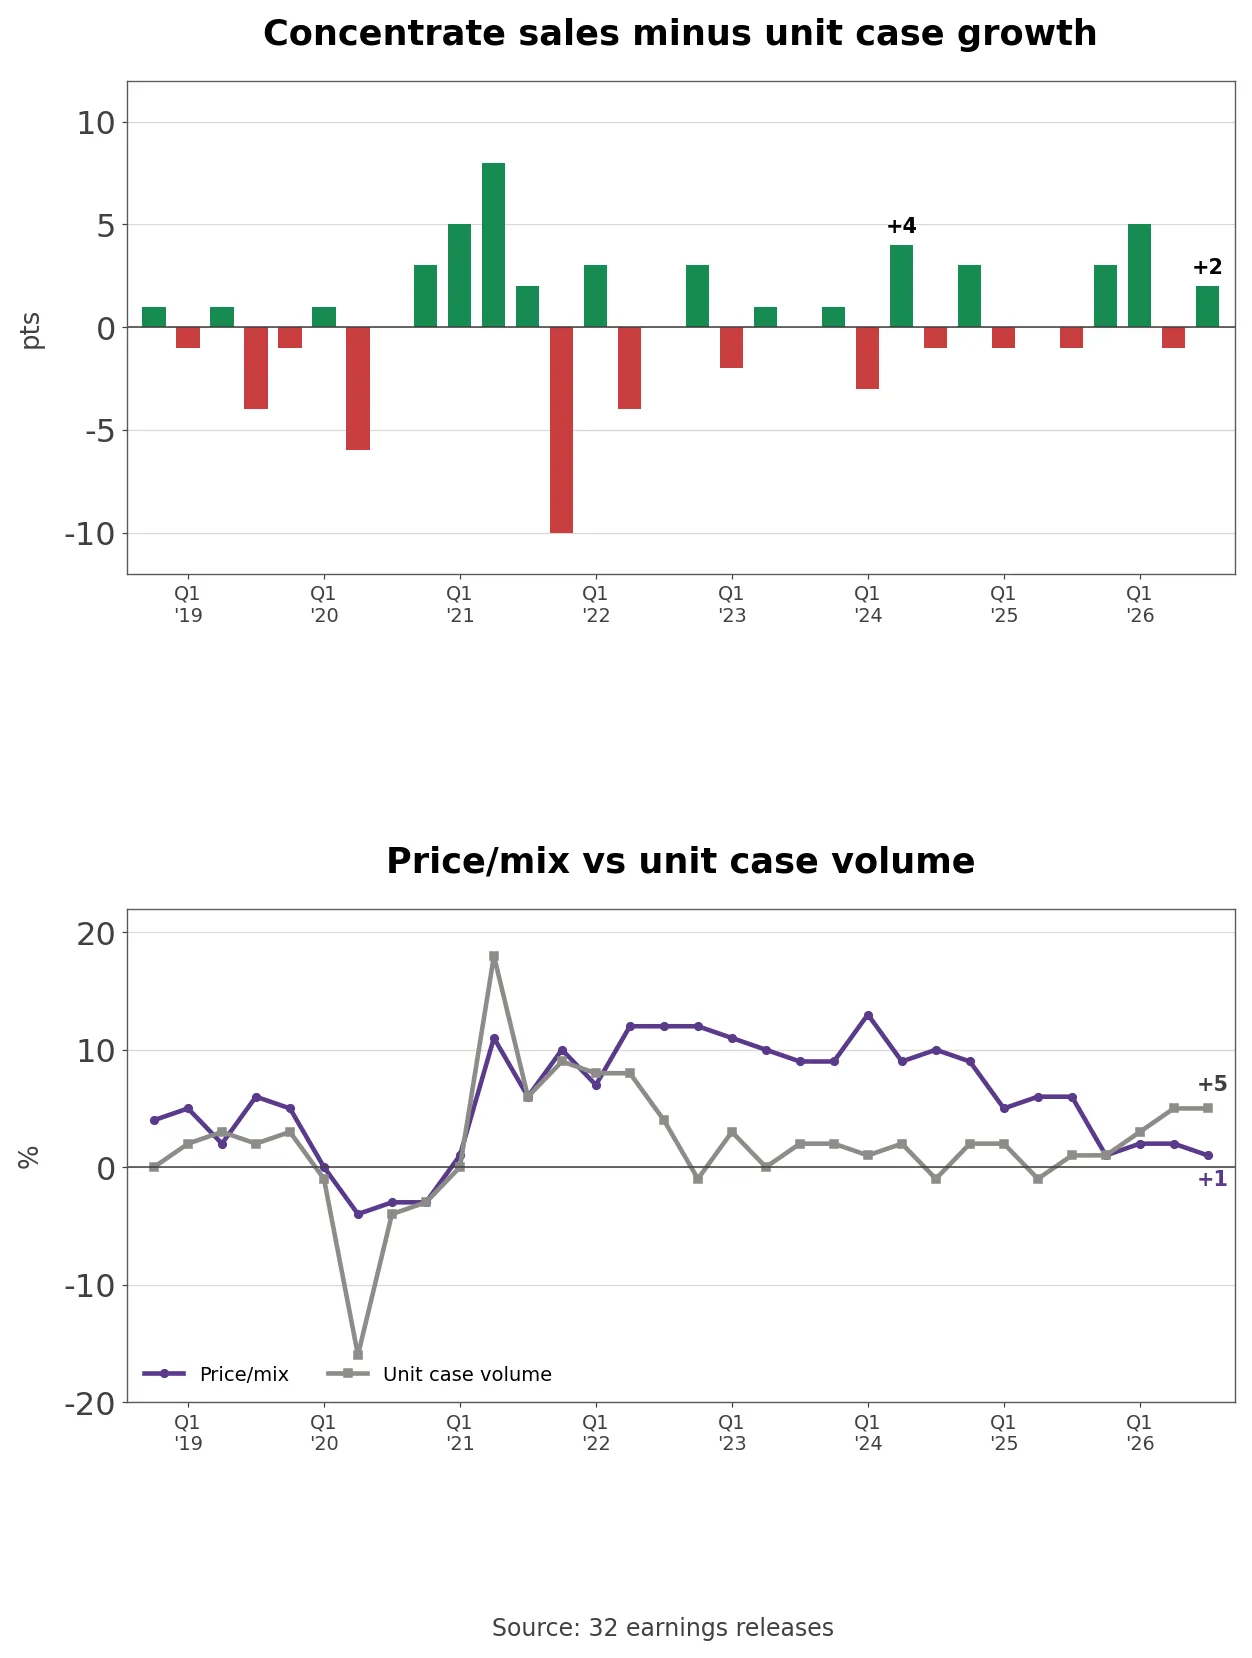
- Across 32 releases from Q4 2018 to Q3 2026, and leaving out quarters with extra days, concentrate ran at least 2 points ahead of unit cases mainly because of shipment timing three times: +3 in Q1 2022, +4 in Q2 2024 and +2 in Q3 2026. The first two reversed in the following quarter, to -4 and -1. In Q3 2026 concentrate ran ahead in all four geographic segments, by 2 points in North America, Latin America and Asia Pacific and 1 point in EMEA.
- The balance between price and volume has also flipped. From 2022 to 2024 price/mix averaged +10.2% a quarter and volume +2.5%, while in the first three quarters of 2026 the averages were +1.7% and +4.3%. High inflation in Argentina pushed Latin American price/mix to an average of 18.2% a quarter from 2022 to 2024, and slide 45 of the overview deck shows annual organic revenue growth of 16% in 2022 and 12% in 2024 before 5% in 2025. Q3’s 1% price/mix ties Q4 2025 for the lowest reading since Q3 2021.
How Coca-Cola Makes Money From Concentrate
- Coca-Cola runs two lines of business. According to the 2025 10-K, concentrate operations made up 59% of net operating revenues and 85% of unit case volume, while finished product operations, which sell through company-owned bottling and distribution companies, made up the rest. Finished product operations bring more revenue but lower gross margins, which is why the company has kept selling bottlers to independent partners. The bottling investments segment fell from 52% of net revenues in 2015 to 12% in 2025.
- In most markets Coca-Cola uses an incidence-based concentrate pricing model. The price it charges for concentrate moves with bottler pricing, the channel where the finished drink is sold and package mix, so when bottlers push smaller, cheaper packs for affordability, Coca-Cola’s price/mix moves with them. That is one route into the three points of unfavorable mix in Q3. In 2025 the five largest independent bottlers, Coca-Cola FEMSA, Coca-Cola Europacific Partners, Coca-Cola HBC, Arca Continental and Swire Coca-Cola, handled 44% of worldwide unit case volume.
- Under the 10-K, bottlers may make and sell Coca-Cola beverages only in a defined territory and must buy all the concentrate or syrup for them from the company or an approved supplier. U.S. expanding bottler agreements renew in 10-year terms with mandatory incidence pricing.
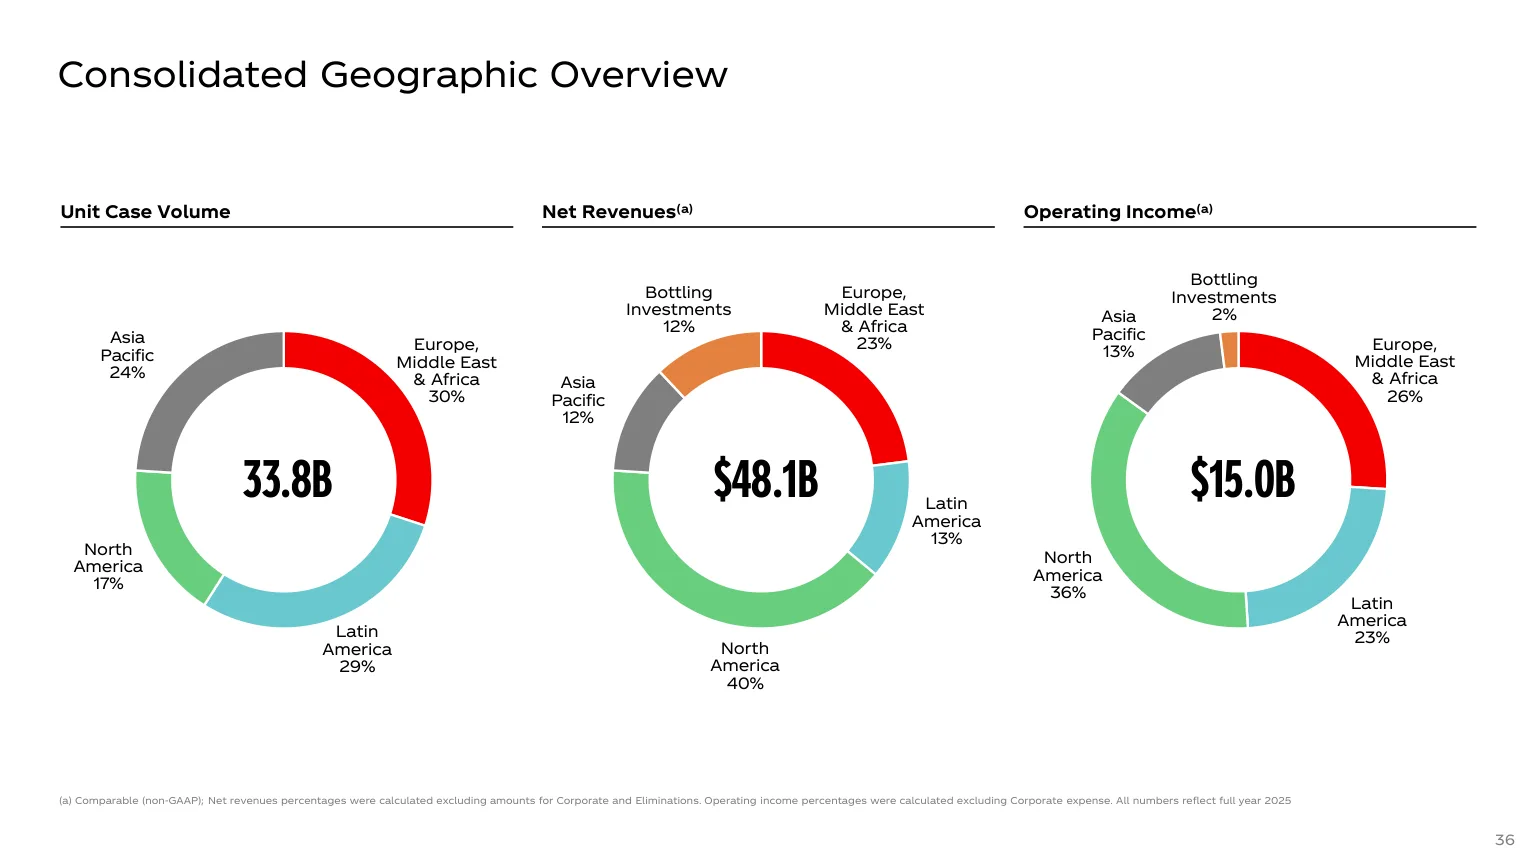
- Slide 36 of the overview deck splits 2025 by region. Of 33.8 billion unit cases, EMEA sold 30%, Latin America 29%, Asia Pacific 24% and North America 17%. Of $48.1 billion of comparable net revenues, North America took 40%, and of $15.0 billion of comparable operating income it took 36%. Latin America turned 29% of volume into 13% of revenue but 23% of operating income. Bottling investments produced 12% of revenue and only 2% of operating income.
- The regions diverged in Q3. North America volume was even, with operating income +5%, which Braun put down to the timing of the July 4 holiday and temporary problems in some finished goods businesses. Latin America grew volume 6% and price/mix 7%, and currency lifted reported revenue to +25%. Asia Pacific grew volume 6% but price/mix was -2%, and EMEA grew volume 5% while losing value share in France and the United Kingdom. Coca-Cola Zero Sugar grew 16%. Equity method investments, including bottlers and Monster Beverage, were $20.71 billion and earned $653 million in Q3.
How Coca-Cola Compares With Three Beverage Peers
- The peers are three U.S.-listed beverage companies that compete for the same shelf space. PepsiCo sells drinks and snacks and does much of its own bottling, so its revenue is about twice Coca-Cola’s at half the margin. Keurig Dr Pepper sells coffee systems and soft drinks, and Monster sells energy drinks. Monster is also a company Coca-Cola holds an equity stake in, and Coca-Cola’s bottlers distribute its drinks under coordination agreements that pay Coca-Cola fees.
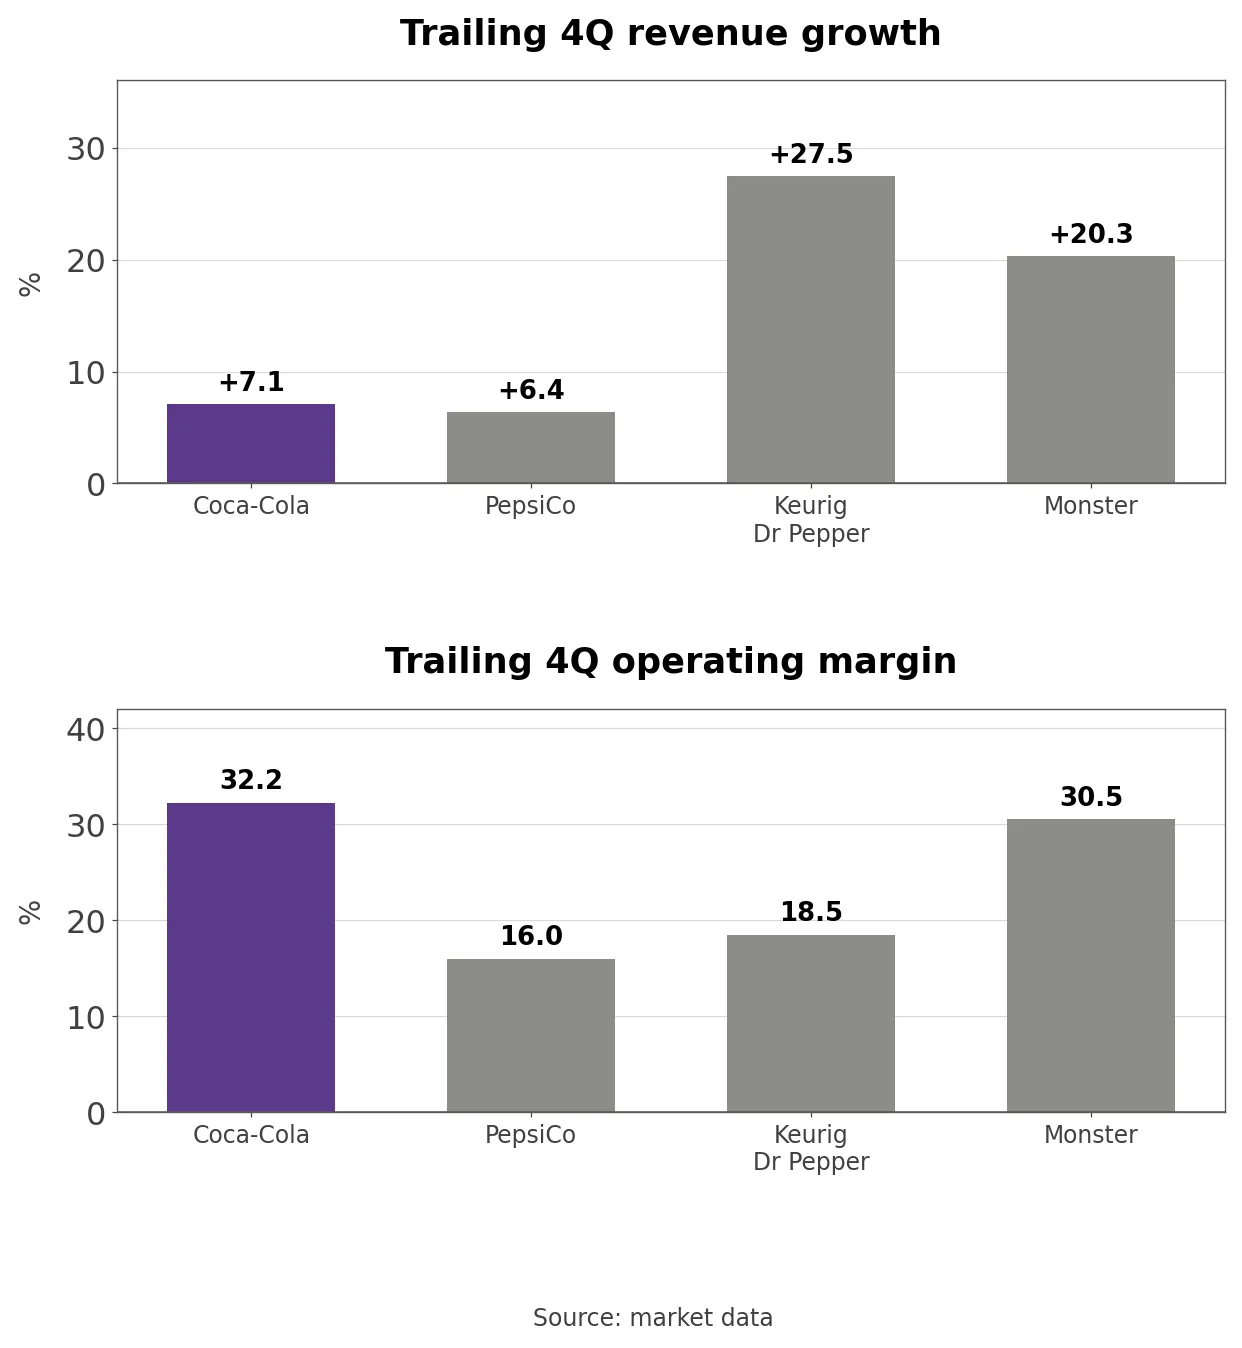
- Trailing four-quarter revenue growth was +27.5% at Keurig Dr Pepper, +20.3% at Monster, +7.1% at Coca-Cola and +6.4% at PepsiCo, with Keurig Dr Pepper and Monster through Q2 2026. Keurig Dr Pepper’s figure includes its acquisition of JDE Peet’s and preparation for a 2027 separation. Operating margins were 32.2% at Coca-Cola, 30.5% at Monster, 18.5% at Keurig Dr Pepper and 16.0% at PepsiCo.
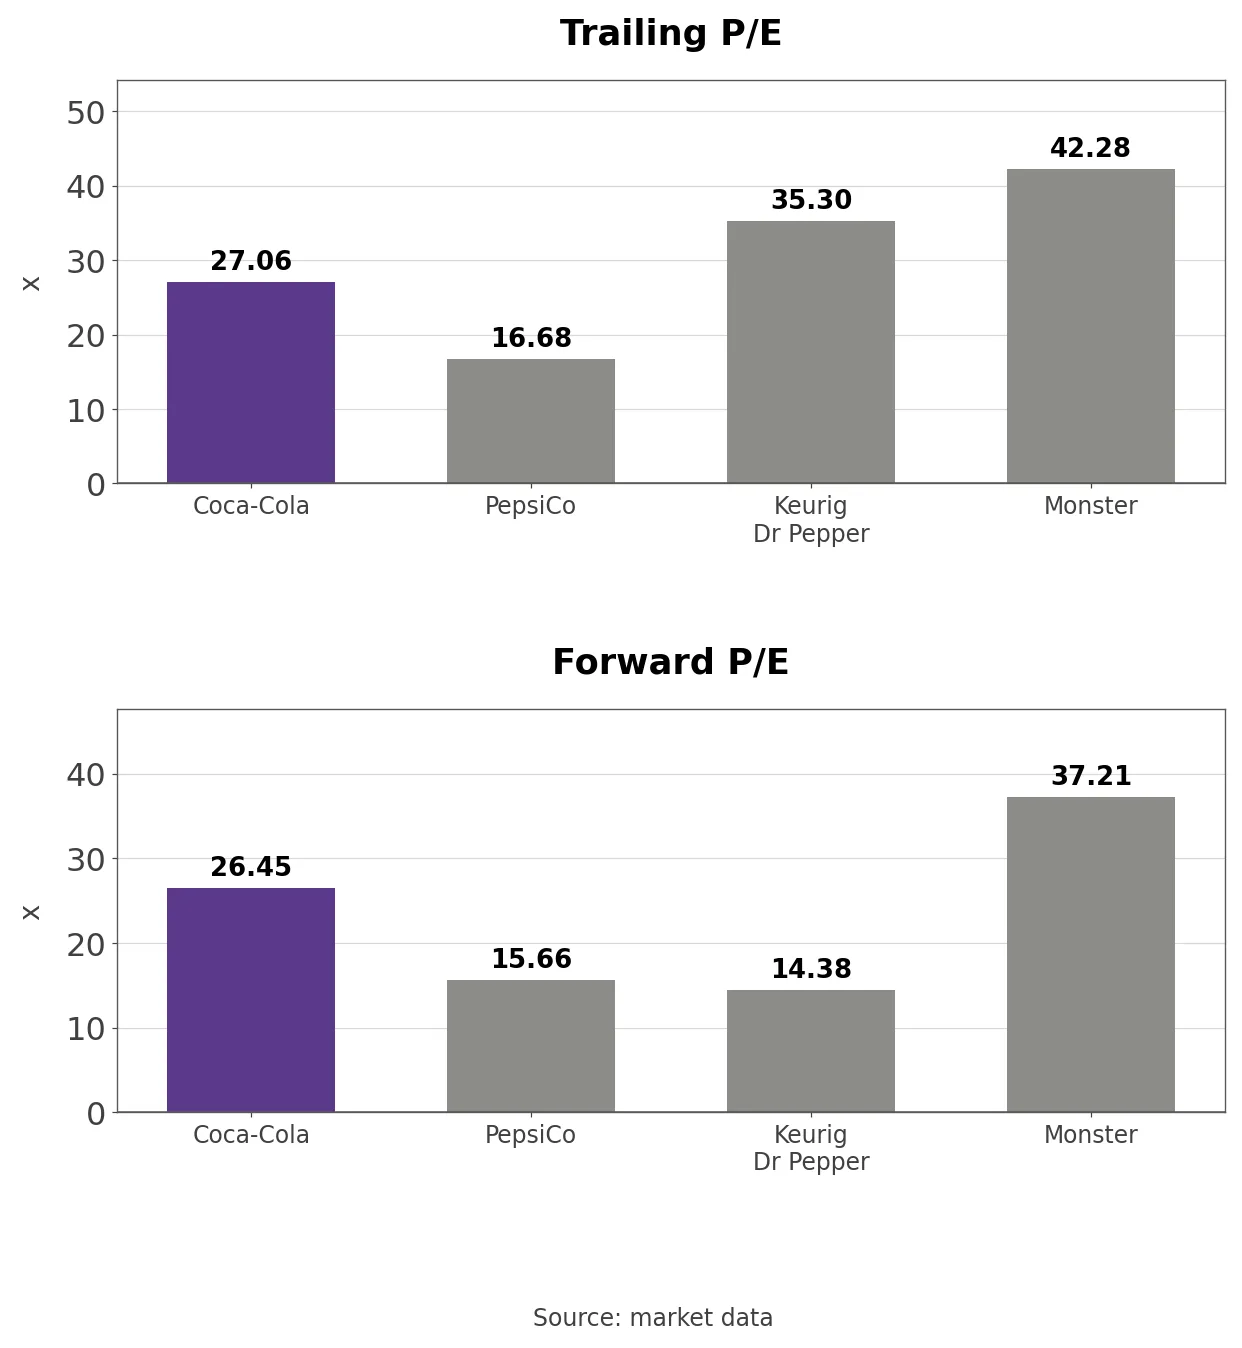
- Trailing P/E stood at 42.28 for Monster, 35.30 for Keurig Dr Pepper, 27.06 for Coca-Cola and 16.68 for PepsiCo, and forward P/E at 37.21, 14.38, 26.45 and 15.66 in the same order. Coca-Cola grows at about PepsiCo’s pace but trades at 1.6 times its multiple, and its 2.31% dividend yield is about half of PepsiCo’s 4.46%.
Coca-Cola’s P/E and Price-to-Sales Band
- On GAAP diluted EPS the trailing P/E of 26.98 sits at the 66th percentile of the 59 months since December 2021, close to the median of 26.16. The low was 22.03 in September 2025 and the high 29.82 in September 2024. The multiple was 23.00 in December 2025, and the +31.2% move in the stock since then is the product of trailing EPS growth of +11.8% and a P/E expansion of +17.3%.
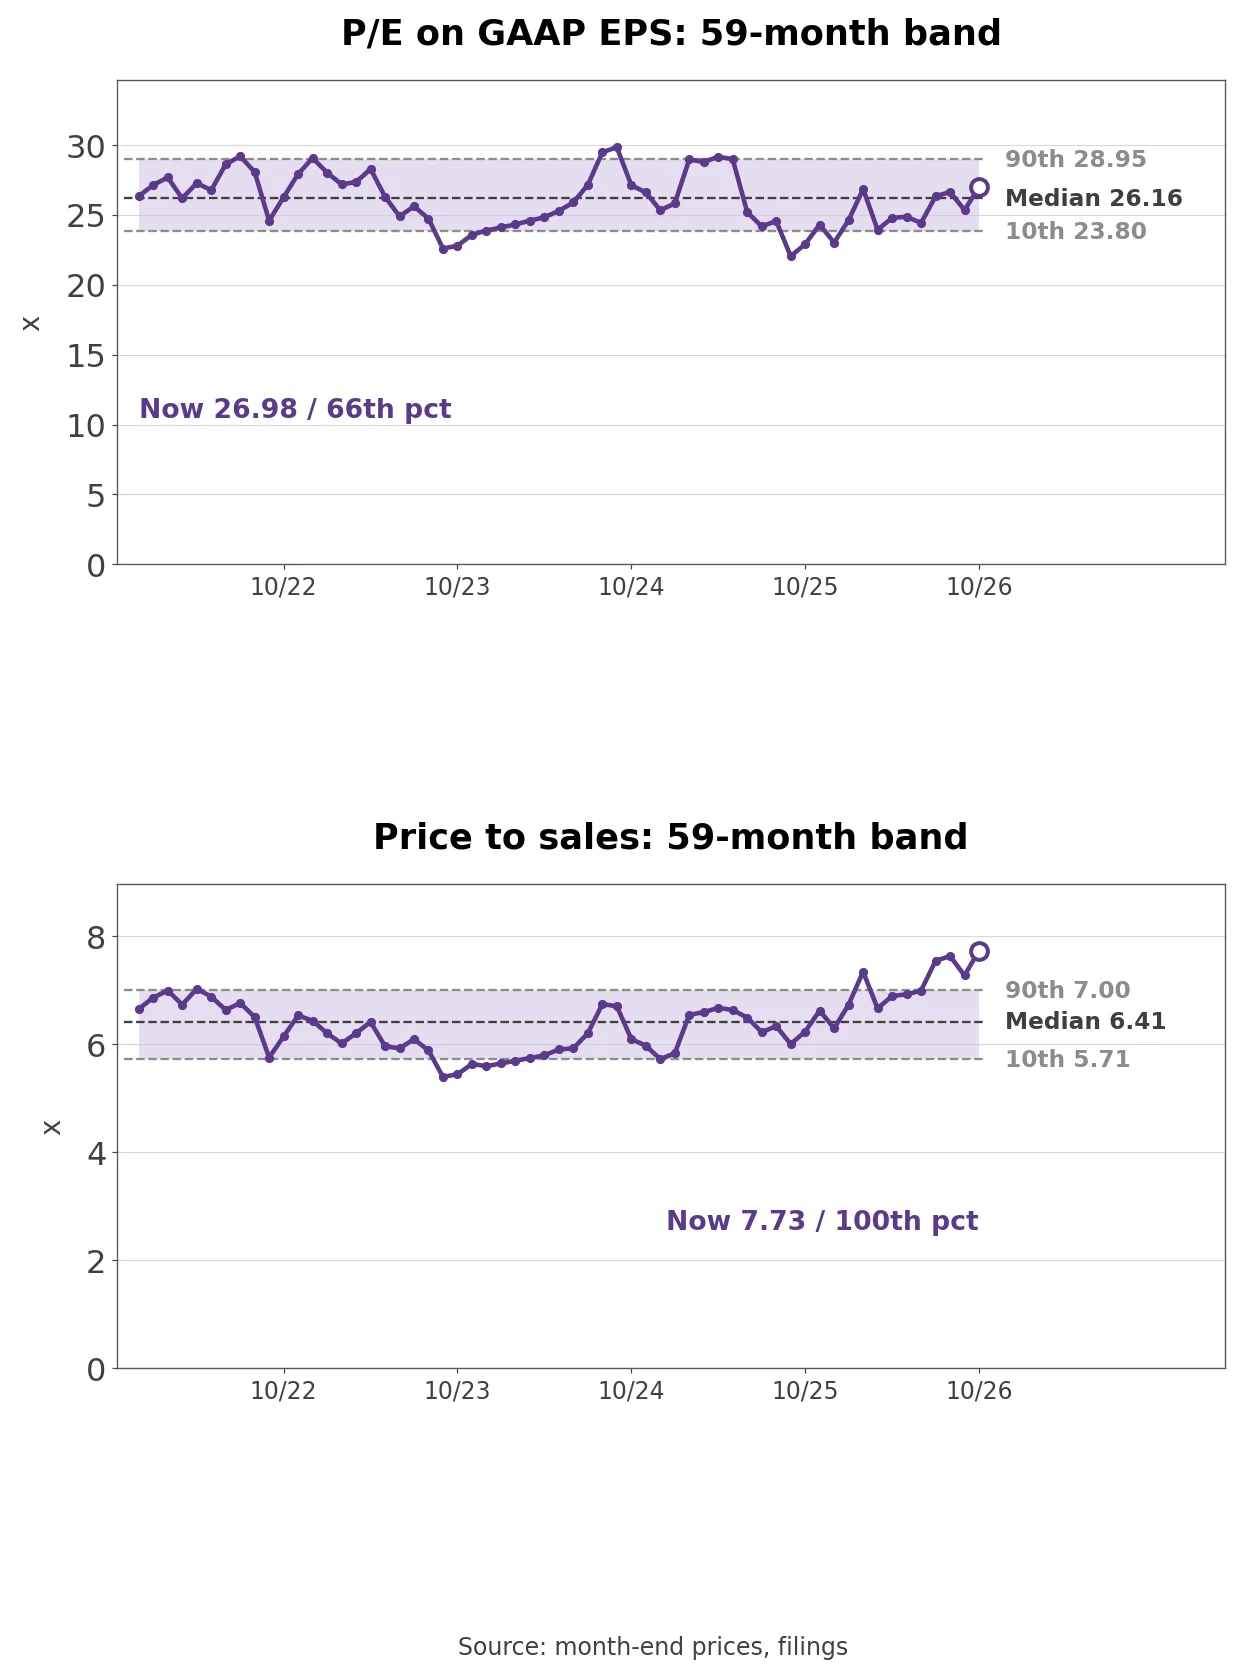
- The price-to-sales ratio of 7.73 is the highest of the 59 months, 1.32 points above the median of 6.41. Operating margin rose from 19% to 24% a quarter in 2024 to 33% to 35% in 2026, so each dollar of revenue now carries more earnings, which keeps the P/E near the middle while the sales multiple sits at the top. A 3.8-point higher tax rate would lift the P/E by about 5% at the same share price.
- Outside view (consensus estimates, market data): Average EPS estimates are $3.33 for 2026 and $3.52 for 2027, which puts the stock at 26.1 times 2027 earnings. A second data source shows a P/E of 27.46 against a five-year median of 24.33 and a price-to-sales ratio of 7.71 against a five-year median of 6.38.
Three Conditions That Move the Stock
- The Eleventh Circuit ruling is the largest variable. A win returns $6.6 billion and leaves about $30.3 billion of room to 2.5x that could go to buybacks or acquisitions. A loss sends out about $15.4 billion of cash and raises the effective tax rate by about 3.8 points, which takes 2026 comparable EPS down 4.8%.
- Price/mix was 1% in Q3. If the three points of unfavorable mix fade and price/mix returns to the 2% to 3% in the long-term model, organic growth can stay at 4% to 6% even as volume slows. If it stays near 1%, volume has to beat a 2026 that included the World Cup.
- Concentrate shipments get tested in Q4. If destocking is as slight as guided and Q4 organic revenue lands near -4%, 2027 starts clean. If more of the early shipments reverse, Q4 and Q1 2027 revenue both take the hit.
What to Watch in the Fourth-Quarter Report
- The next set of numbers arrives in February 2027 with Q4 results and the first 2027 guidance. The first checkpoints are how far Q4 concentrate shipments trailed unit cases and whether Coca-Cola reaffirms 4% to 6% organic growth on a revenue base about 8% smaller after CCBA leaves.
- One question remains open. If Coca-Cola loses, the 3.8-point tax increase is a recurring cost rather than a one-time charge. How much of that scenario is in a 2027 EPS estimate of $3.52 and a trailing P/E of 26.98?
Related Analysis
- Linde (LIN) Stock Analysis: Price, Volume and Margin Trends: another company whose growth splits into price and volume, useful for comparing how Coca-Cola’s mix shifted from price to volume.
- Adobe (ADBE) Stock Analysis: Valuation After the CEO Change: a large company valued after a CEO handover, a reference point for Coca-Cola’s first year under Henrique Braun.