Nucor (NUE) Stock: $247 a Ton and a 17% Import Share
Contents
- Nucor (NYSE: NUE) reported third-quarter 2026 net sales of $11.25 billion, +32.0% from a year earlier, and GAAP diluted EPS of $5.80 against $2.63. Management called it the strongest quarter in three years. Yet steel mills pre-tax earnings per ton were $247, only 46.3% of the $533 Nucor earned in Q4 2021, while the mill spread, the external selling price per ton minus scrap cost, recovered to $812, or 83.7% of that quarter’s $970. The question running through this piece is why the market now pays close to a peak price-to-book multiple for a company earning about half its peak profit per ton, and where that case could crack.
- Nucor melts scrap in electric arc furnaces to make sheet, bar, structural and plate steel, then turns part of that steel into joists, deck, tubing, racks, doors and utility towers; the company calls itself North America’s largest recycler. At $271.79 a share it is worth about $61.9 billion, and the stock is +66.6% in 2026 on month-end closes, above its March 2024 high of $197.90.
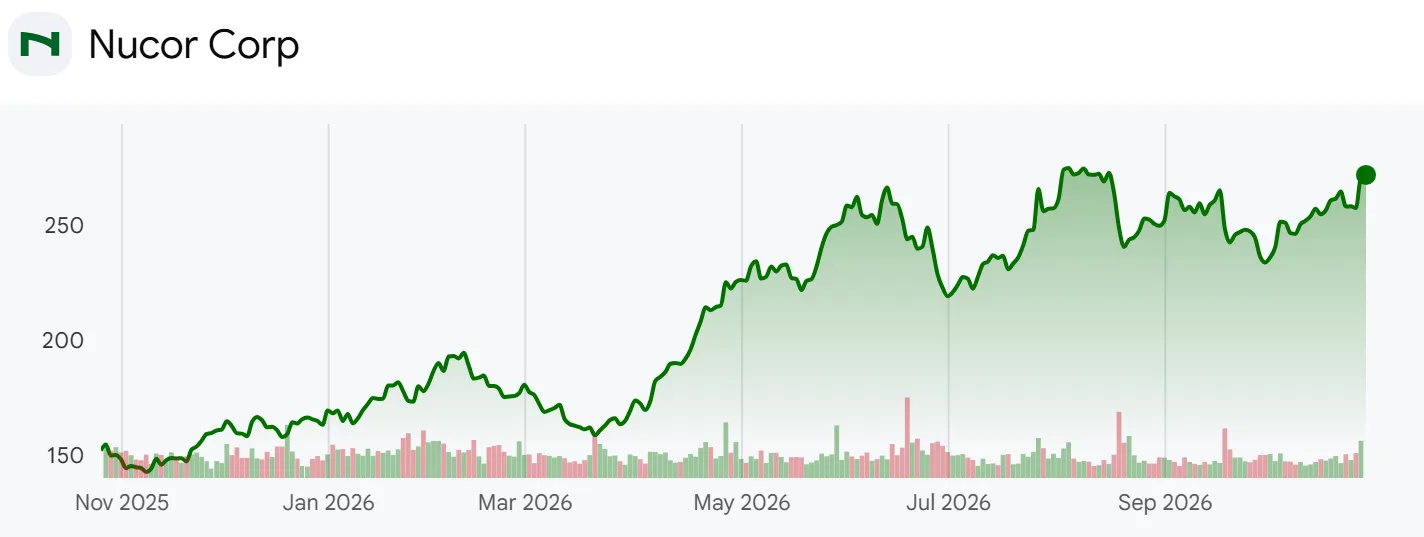
- The analysis rebuilds 20 quarters of mill earnings per ton from 16 earnings decks and 23 quarters of prices and scrap costs from three year-end appendices, checked against the Q3 earnings release, the Q3 deck, the 2025 10-K and the Q2 10-Q. The P/E uses trailing twelve-month (TTM) GAAP diluted EPS of $15.71, or 17.30 times. The spread is a simple difference between the external mill price and scrap cost per gross ton, not Nucor’s internal metal margin, and since “On average, it takes approximately 1.1 tons of scrap and scrap substitutes to produce one ton of steel,” it slightly understates raw material cost.
Mill Profit in the Q3 Deck After the Q2 Refund
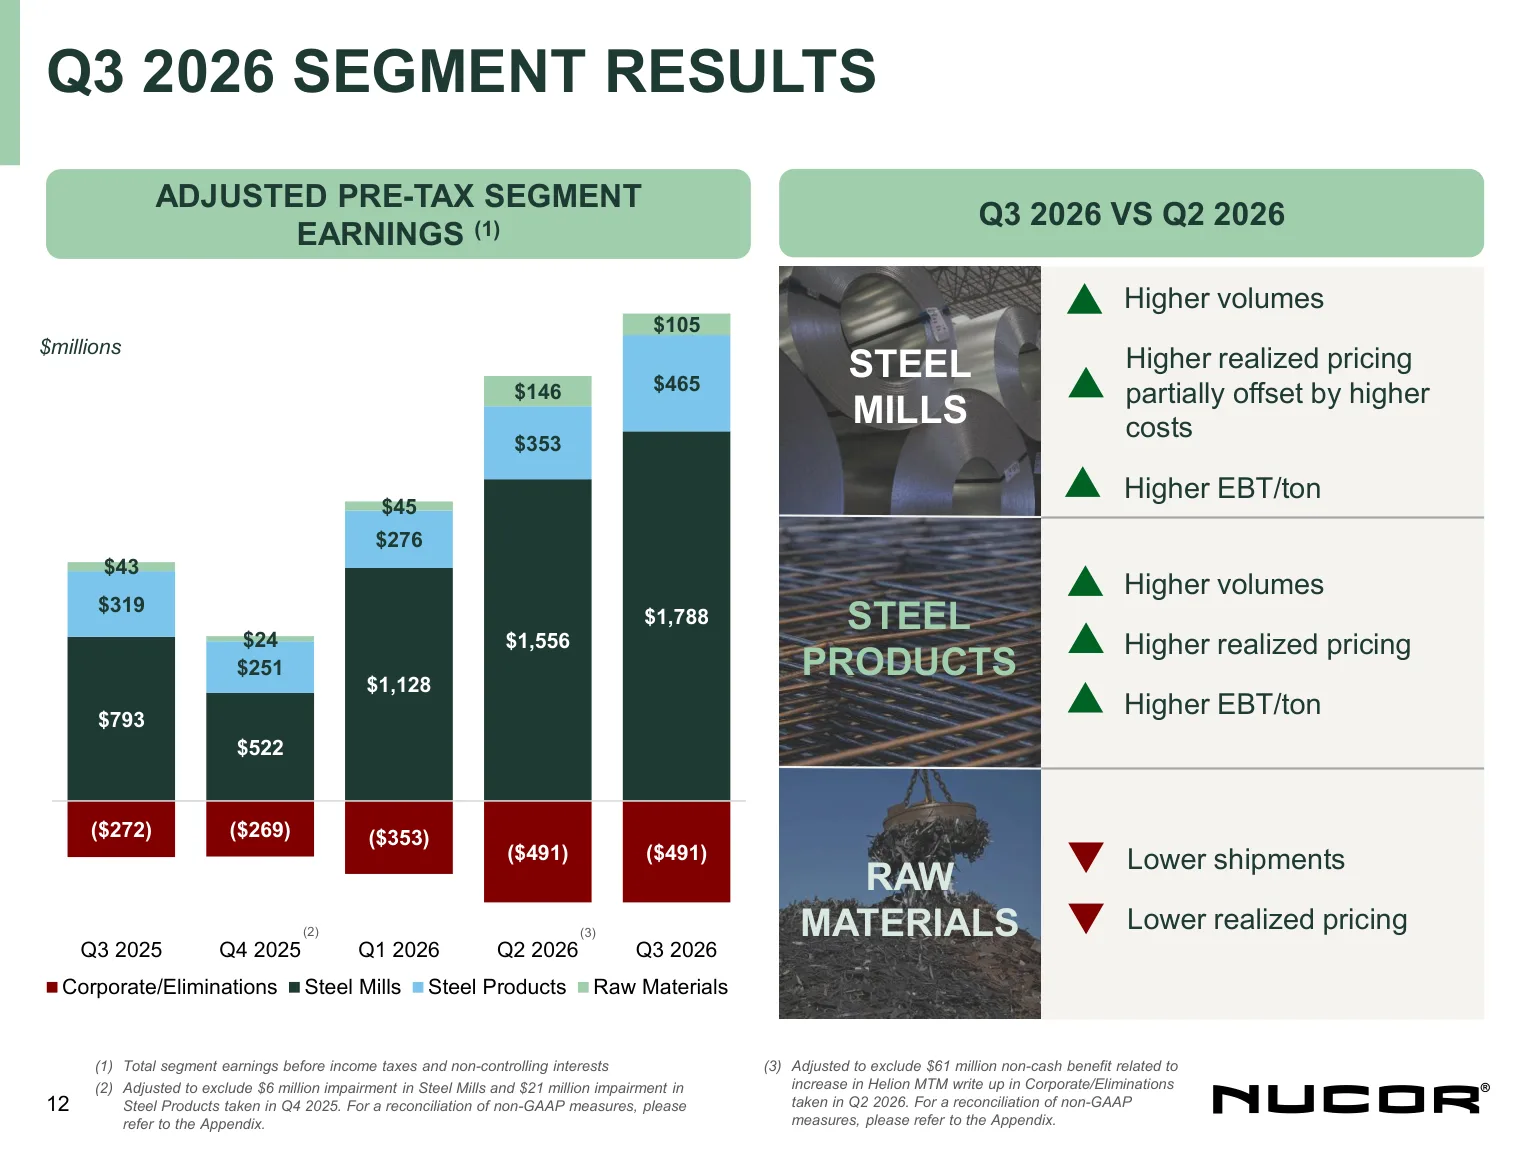
- Slide 12 of the Q3 deck stacks segment pre-tax earnings for five quarters. Steel mills went from $793 million in Q3 2025 to $522 million, $1.128 billion, $1.556 billion and $1.788 billion. In Q3 steel products earned $465 million and raw materials $105 million, while corporate and eliminations took $491 million, the same as Q2 after excluding a $61 million mark-up on Nucor’s stake in the fusion company Helion. The slide credits higher volumes and realized pricing in the mills, partly offset by higher costs.
- Slide 17 puts steel mills shipments at 7.23 million tons, a record for the third quarter in a row, and earnings per ton at $247 against $123 a year earlier. Steel products shipped 1.36 million tons (+15%) and earned $341 a ton against $270, and slide 5 says joist and deck shipments rose 20% from Q2 with realized pricing up $110 a ton. Raw materials earned less as Louisiana direct reduced iron (DRI) production fell 13% and prices eased.
- Filing note (Q2 10-Q): Steel mills earnings in Q2 included “a reduction to cost of products sold of $130 million related to cash refunds associated with prior periods’ raw materials procurement costs.” On the Q3 call the CFO, Jack Sullivan, described it as a tariff refund that did not recur in Q3.
- Own calculation (refund-adjusted mill earnings): Without the refund, Q2 steel mills earned $1.426 billion, or $200.8 a ton. Q3’s $1.788 billion is +14.9% over reported Q2 but +25.4% over the refund-adjusted figure, and per-ton earnings rose from $200.8 to $247.
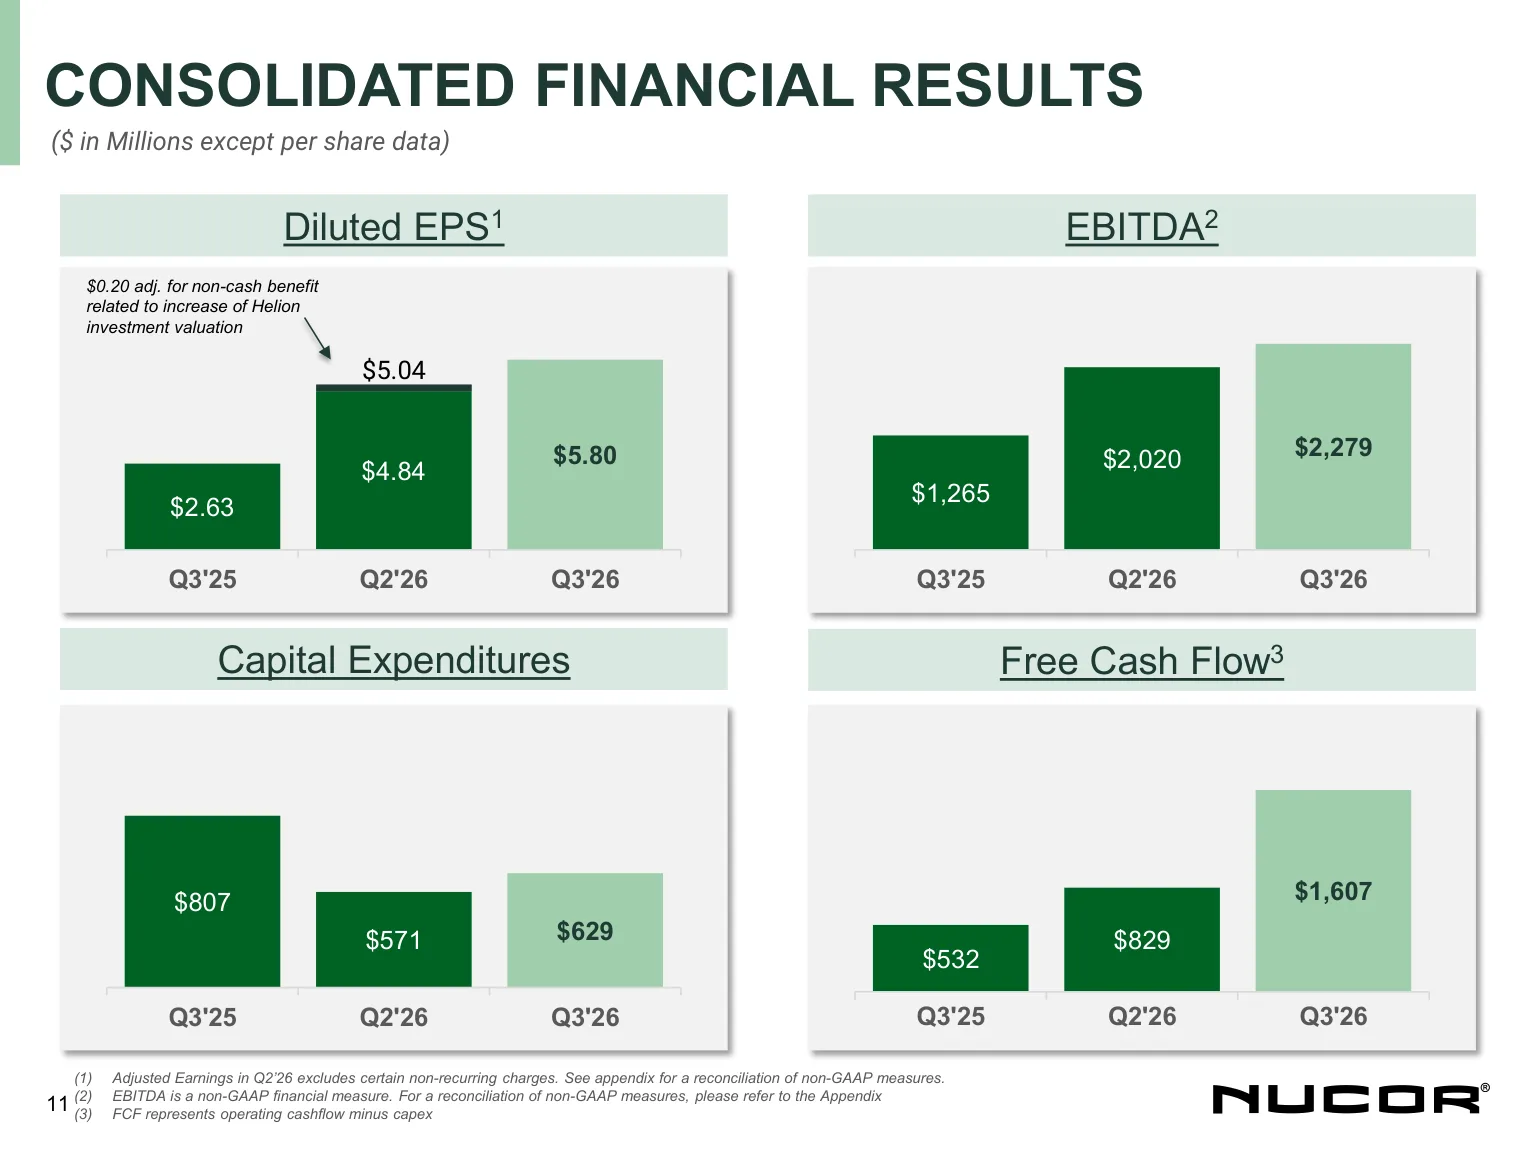
- Slide 11 compares Q3 2025, Q2 2026 and Q3 2026: EBITDA rose from $1.265 billion to $2.279 billion and free cash flow from $532 million to $1.607 billion, while capital spending fell from $807 million to $629 million. Free cash flow, a non-GAAP measure Nucor added to the release this quarter, totals $2.661 billion for nine months.
- The release’s outlook: “We expect earnings in the fourth quarter of 2026 to be generally in-line with or modestly higher than the third quarter.” Slide 14 sees mills and steel products stable as higher pricing offsets seasonally lower volumes, and raw materials slightly lower on DRI prices. Sullivan added that shipments have historically fallen about 7% from Q3 to Q4, with five to six fewer shipping days, so the quarter depends on price making up for volume.
- Company disclosure (Q3 earnings release): CEO Leon Topalian said, “Supported by robust demand across key end markets, Nucor has generated approximately $2.7 billion of free cash flow and returned nearly $1.4 billion to shareholders through the first nine months of the year.” He pointed to the first heat at the West Virginia sheet mill in September and the start-up of a second galvanizing line at Nucor Steel Berkeley as milestones.
The Import Share Slide and the Korean Surge
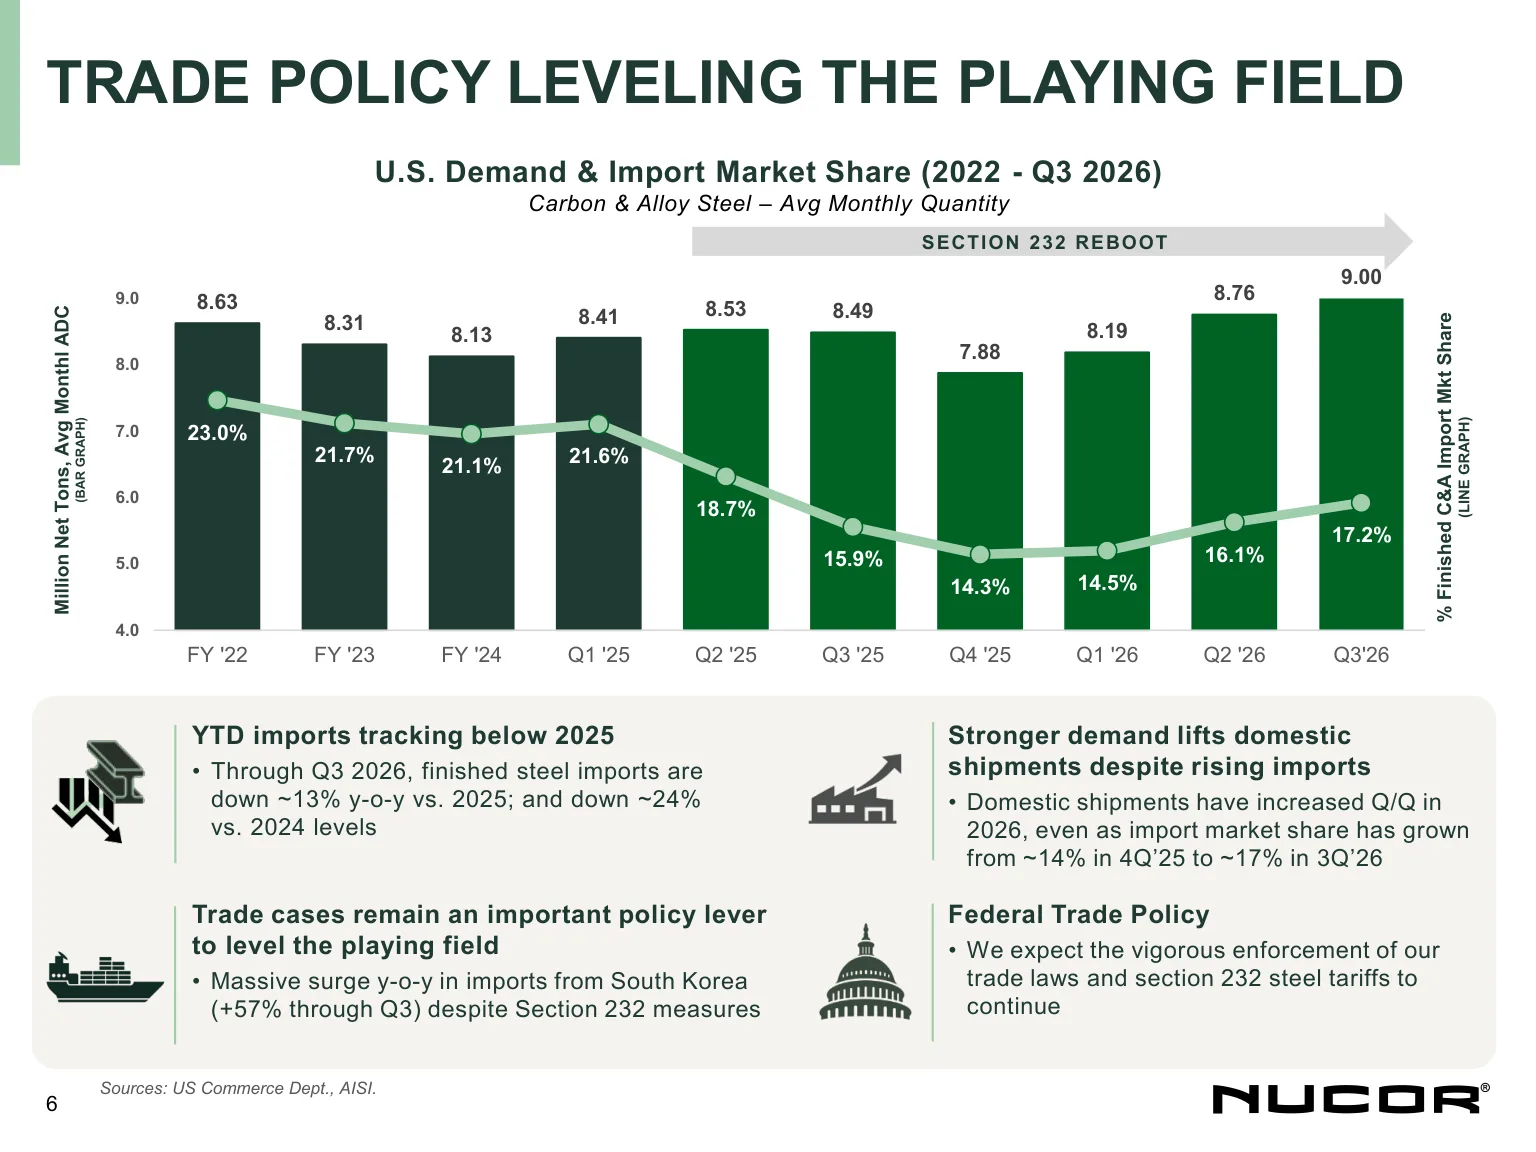
- Slide 6 is titled “Trade Policy Leveling the Playing Field.” The bars show US carbon and alloy steel demand as a monthly average, and the line shows the finished-steel import share: 23.0% in 2022, 21.1% in 2024 and 21.6% in Q1 2025, falling to 14.3% in Q4 2025. Then it turns: 14.5% in Q1 2026, 16.1% in Q2 and 17.2% in Q3. The slide notes that imports through Q3 are down about 13% from 2025 and about 24% from 2024, and on the same page states: “Domestic shipments have increased Q/Q in 2026, even as import market share has grown from ~14% in 4Q’25 to ~17% in 3Q’26.”
- A box at the bottom of the slide adds: “Massive surge y-o-y in imports from South Korea (+57% through Q3) despite Section 232 measures.” On the call, Topalian said imports had risen in recent months despite the Section 232 tariffs, including from Korea, and that Nucor would work closely with the administration to keep trade measures effective.
- Own calculation (import tonnage from slide 6): Multiplying demand by import share gives monthly import tonnage. Imports averaged 1.38 million tons a month in the first three quarters of 2026, 12.9% below 1.59 million a year earlier, which matches the slide’s figure of about 13%. By quarter, though, Q3 imports of 1.55 million tons were 14.7% above Q3 2025’s 1.35 million and 37.4% above the Q4 2025 low of 1.13 million.
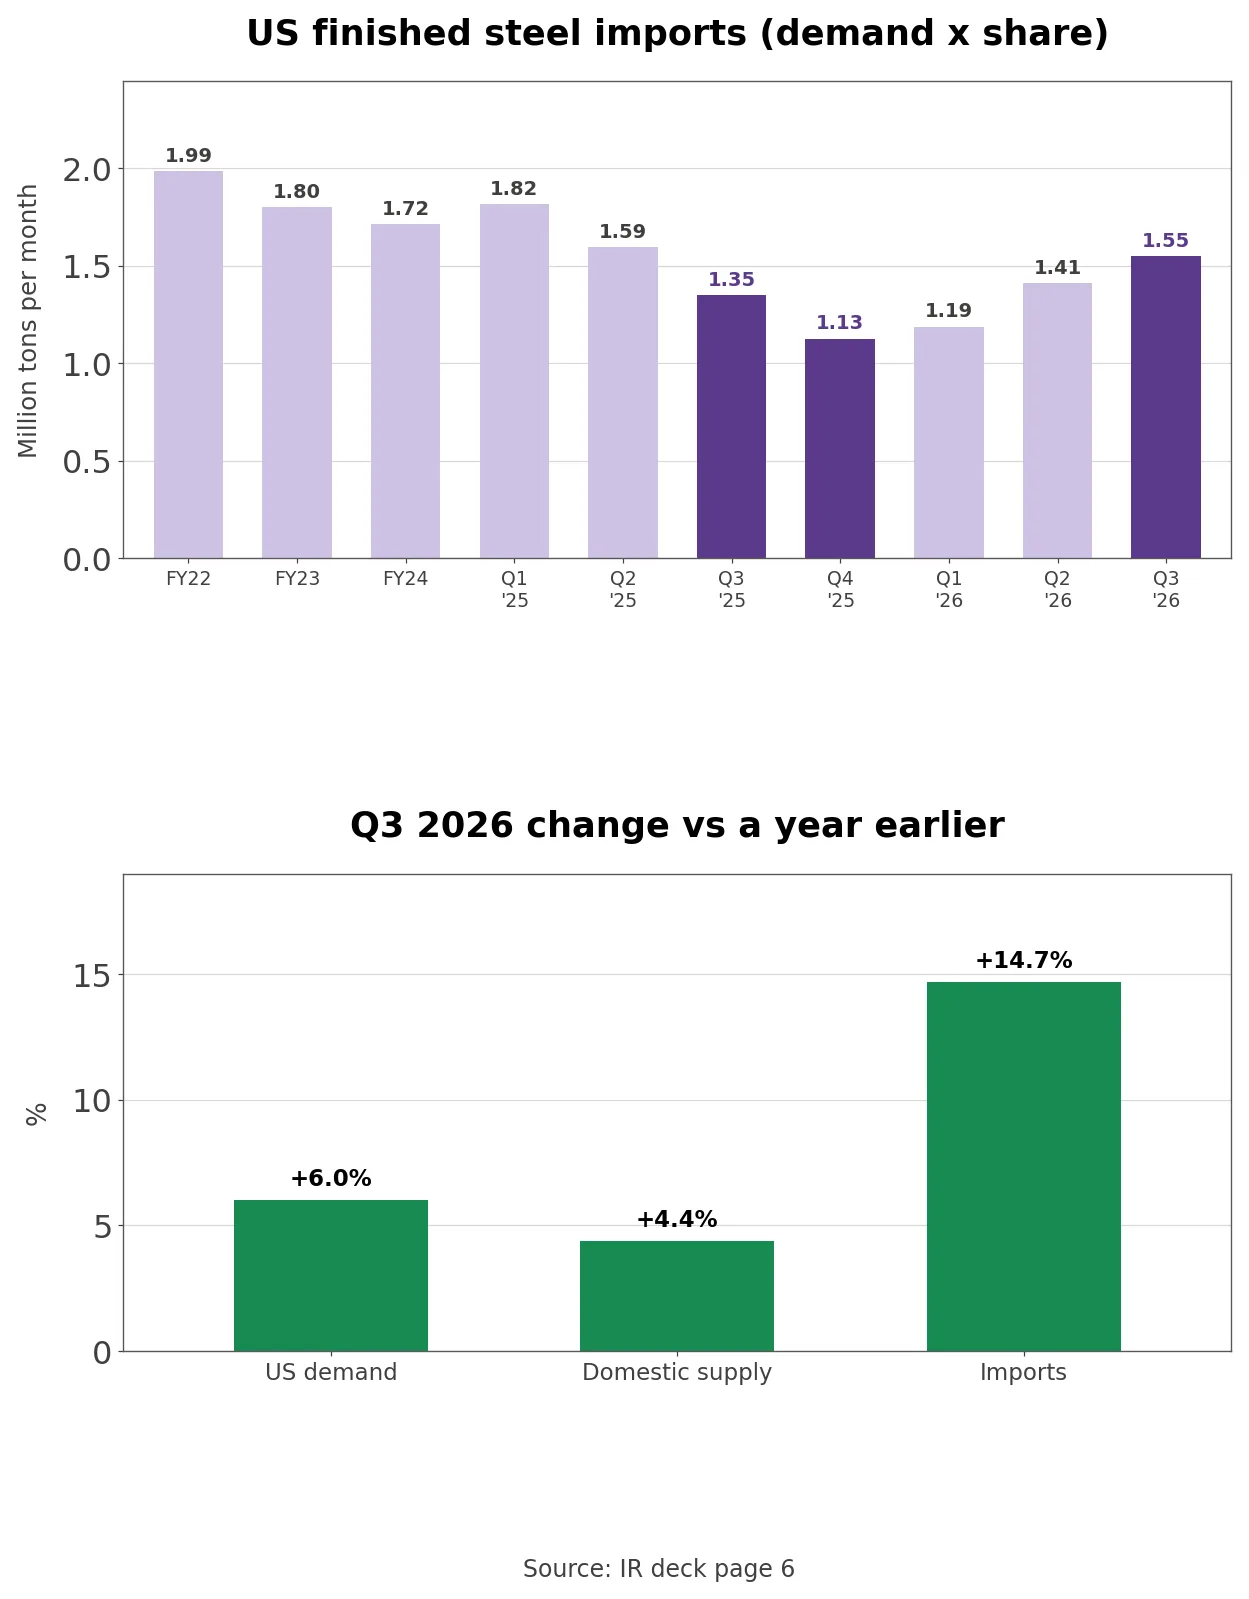
- The year-to-date decline compares against a heavy first half of 2025; the quarterly trend has already turned above last year. In Q3, US demand rose +6.0% from a year earlier, domestic supply (demand minus imports) +4.4% and imports +14.7%. Of the 510 thousand tons of added monthly demand, about 200 thousand, or 38.8%, went to imports.
- Filing note (2025 10-K risk factors): Nucor wrote that the Section 232 tariffs were fully reinstated in 2025 without exceptions or exclusions and broadened to about 600 fabricated steel products. The same section warns that “if relatively higher U.S. steel prices or a stronger U.S. dollar make it attractive for foreign steelmakers to export their steel products to the United States,” a resurgence of imports “could create downward pressure on U.S. steel prices.”
- In Q3, Nucor’s external mill price was +18.8% from a year earlier and its sheet price +21.1%. The condition the 10-K describes, high US prices, and the result the deck reports, imports rising under the tariff, showed up in the same quarter.
The Bull and Bear Case for Nucor Shares
- The bull case rests on volume and cash. Mill shipments set records three quarters running, and management expects 2026 to be the third-best year in Nucor’s history and 2027 to be stronger. Capital spending is past its 2024 to 2025 peak, and the 3-million-ton West Virginia mill ramps toward 50% utilization by the end of 2027.
- The bear case rests on earnings quality and imports. The spread is back near 84% of its 2021 peak while earnings per ton are below half, and the depreciation and start-up costs behind that gap will not shrink in 2027. Import share has risen three quarters in a row, and price-to-book stands at 2.71, just below the April 2022 peak of 2.76.
From Steel Mills to Doors Racks and Towers
- Nucor’s month-end close rose from $48.73 in January 2021 to $154.78 in April 2022. Diluted EPS peaked at $9.67 in Q2 2022, and in June 2022, when TTM EPS reached $32.59, the P/E was 3.20. The market treated those earnings as a peak that would not last, and quarterly EPS did fall to $0.67 by Q1 2025.
- Over the same years the company pushed beyond steel, deploying about $19 billion over six and a half years, half organic and half acquisitions, according to the CEO. The 10-K records 51% of California Steel Industries and Summit Utility Structures, the seed of the towers business, in 2022, then Southwest Data Products for $115 million and the door maker Rytec for $565 million in 2024.
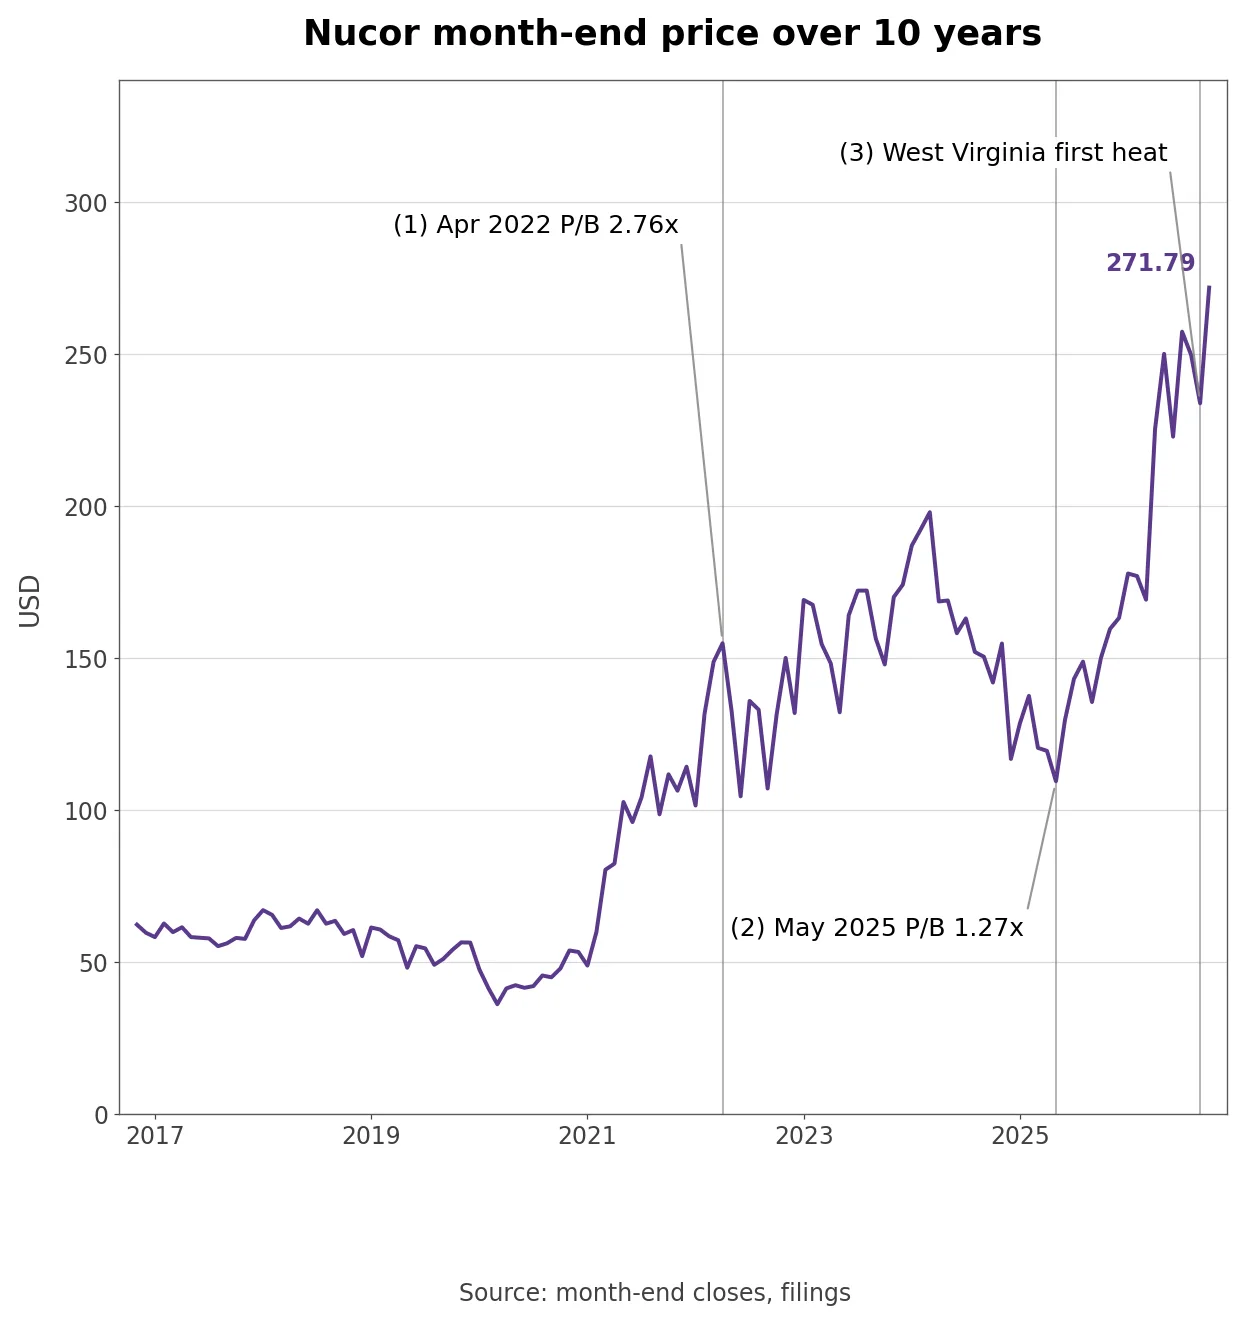
- The stock fell to $109.36 in May 2025, at a price-to-book of 1.27, and has since risen 2.49 times as the tariff reinstatement cut imports and prices and shipments rose together in 2026. CFO Steve Laxton became president and COO in January 2026, and Jack Sullivan, who had run investor relations, became CFO in March.
Why Does Nucor’s Profit per Ton Lag the Mill Spread?
- The Q3 mill spread of $812 a ton is 83.7% of Q4 2021’s $970, but earnings per ton of $247 are 46.3% of $533. Where a quarter appears in more than one deck the numbers agree, except Q1 2026 scrap cost, revised from $403 in the release to $404 in the Q3 deck.
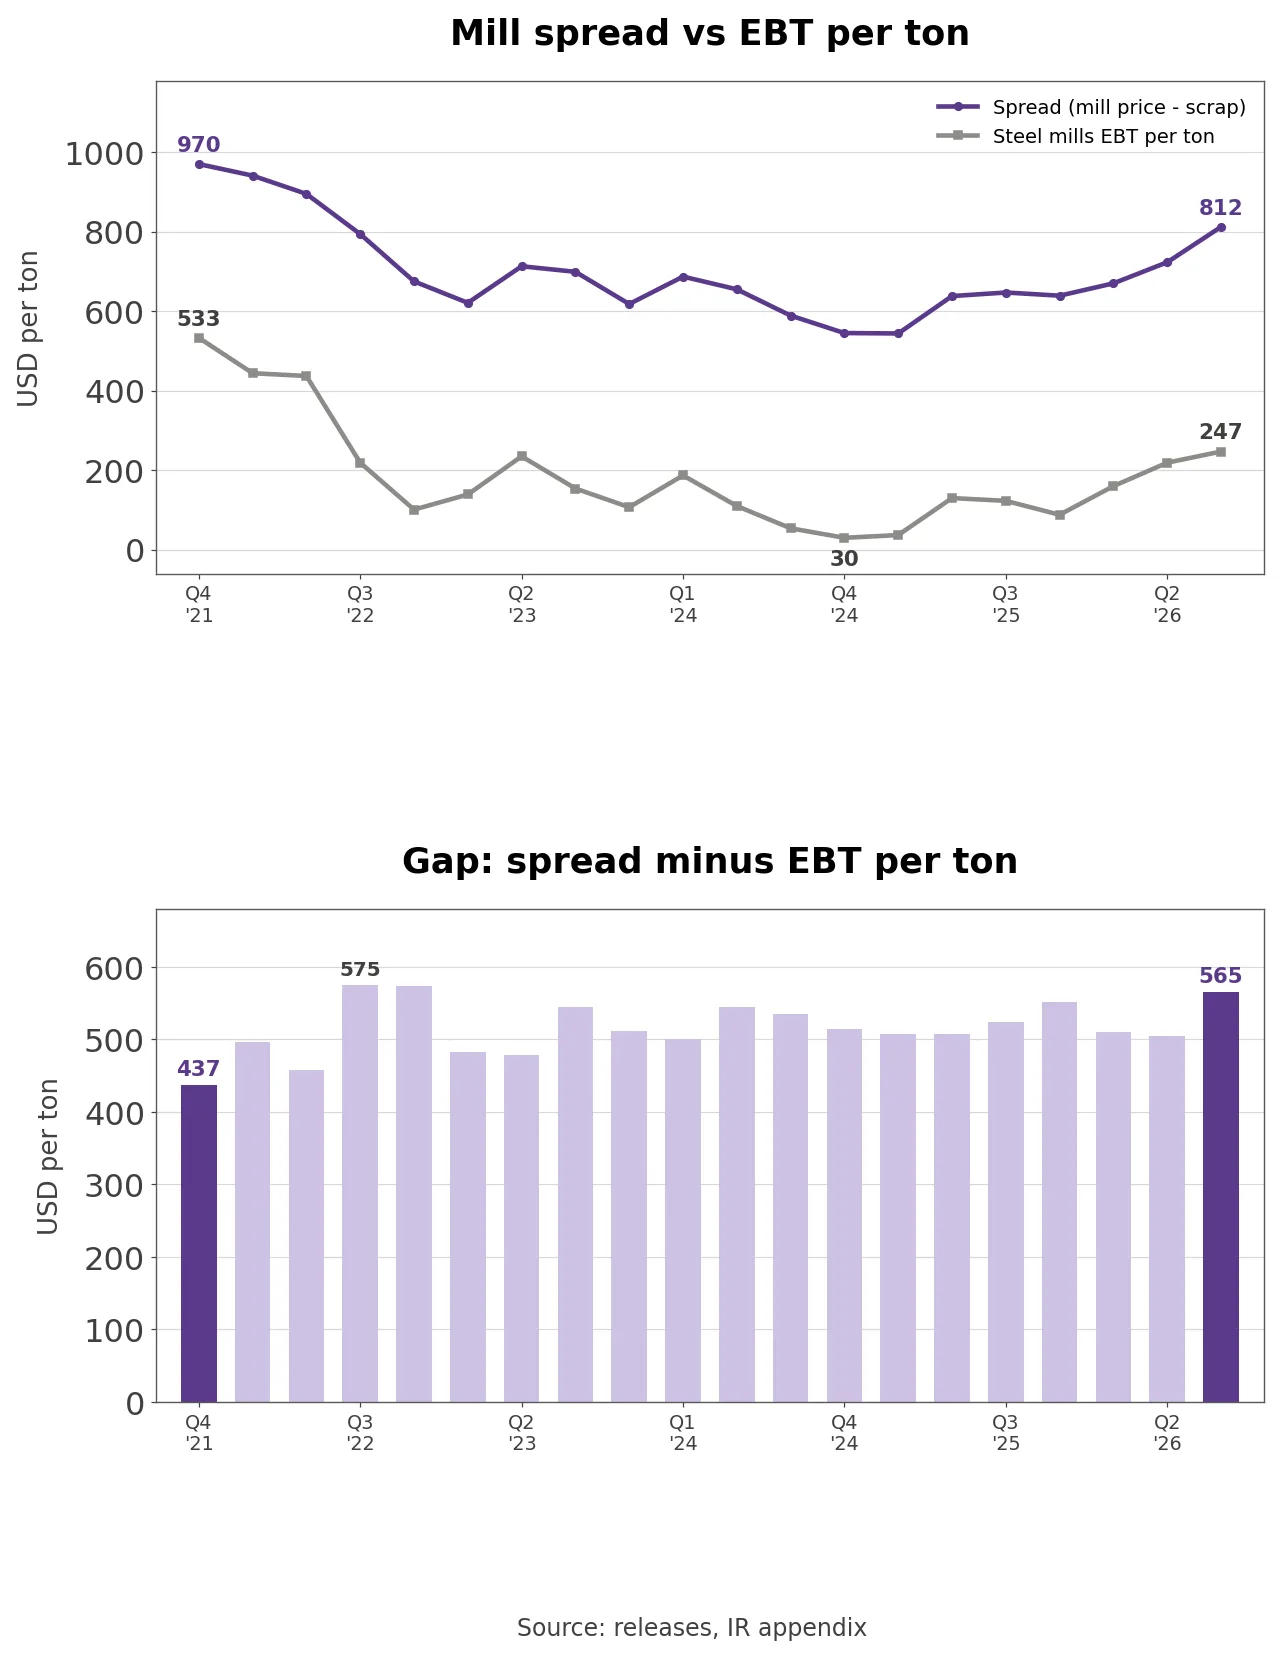
- Own calculation (spread minus earnings per ton): The gap between the spread and earnings per ton widened by $128, from $437 in Q4 2021 to $565 in Q3 2026. Of the 20 quarters, only Q3 and Q4 2022 ($575 and $574) were wider. The gap holds conversion costs such as power, alloys and labor, plus depreciation, start-up costs at new mills and the difference between external prices and internal transfers.
- Part of the gap can be traced. Depreciation in the 10-K rose from $735 million in 2021 to $1.226 billion in 2025, +66.7%, and reached $967 million in the first nine months of 2026. Q3 pre-operating and start-up costs of $124 million equal $17.1 per mill ton, and Nucor expects 2027 start-up costs to be similar to or higher than 2026. Sullivan also cited supplies, freight, energy and planned outages for higher Q3 conversion costs.
- In dollars, consolidated pre-tax earnings were $3.490 billion in Q2 2022 and $1.867 billion in Q3 2026: mills $1.028 billion lower, steel products $665 million lower, raw materials $159 million lower and corporate $228 million less negative. Steel products earned $927 a ton in Q3 2022 against $341 now; the unusual 2022 margins on joists and deck have not returned.
- Volume moved the other way. Mill shipments rose from 5.87 million tons in Q4 2021 to 7.23 million, +23.2%, so even with per-ton earnings below half, mill pre-tax earnings are back to 57.1% of the peak. The market is looking ahead to West Virginia’s 3 million tons spreading depreciation and start-up costs over more tons.
- Government data (FRED WPU1017 and CAPUTLG3311A2S): The steel mill products price index averaged 381.1 in Q3, 24.4% above a year earlier and 85.7% of its Q4 2021 level, in line with Nucor’s mill price at +18.8% and 83.4%. Industry capacity utilization averaged 74.3% against Nucor’s 89%.
How Nucor Makes Money Across Three Segments
- Steel mills melt scrap and substitutes such as DRI and pig iron into sheet, bar, structural and plate steel, selling 79% of 2025 shipments to outside customers and 21% to Nucor’s own steel products segment. The 10-K lists six sheet mills with about 14.5 million tons of capacity, 15 bar mills with 9.8 million, two structural mills and three plate mills with 3.6 million, selling mainly to service centers, fabricators and manufacturers. Electric arc furnaces make Nucor more sensitive to scrap prices but lighter on fixed costs, the company says. In 2025 net sales were $32.49 billion at an average $1,221 a ton.
- Of Q3’s 5.66 million tons of external mill sales, sheet was 2.56 million, bar 1.84 million, plate 0.70 million and structural 0.57 million. Plate shipments rose from 594 thousand tons to 782 thousand, +32%, with the Brandenburg plate mill in Kentucky supplying about 240 thousand, roughly a third. The Lexington rebar micro mill in North Carolina ran close to 80% utilization in Q3.
- Steel products buys steel from the mills and turns it into building and industrial products: joists and deck that hold up roofs and floors in warehouses, data centers and factories (about 1.3 million tons of capacity), fabricated rebar, tubing, metal buildings, insulated panels, warehouse and data center racks, overhead doors and utility structures. Of Q3’s 1.36 million tons of external shipments, tubular products were 375 thousand, up from 206 thousand a year earlier, and joists and deck sold for $2,560 a ton.
- Raw materials combines The David J. Joseph Company’s scrap processing and brokerage, the Louisiana DRI plant and natural gas production; most output feeds Nucor’s own mills, so Q3 external sales were 508 thousand tons. A carbon capture project with ExxonMobil at the DRI plant started in Q3 and can store up to 800 thousand tons of CO2 a year.
New Demand From Data Centers and the Power Grid
- Data centers are about 15% of the total backlog, the CEO said, alongside chip plants, gas-fired power, LNG terminals, nuclear and utilities. The 10-K says the Southwest Data Products deal added airflow containment, cabinets, caging and installation for data centers. Slide 10 cites investor-owned utility capex of about $1.4 trillion over 2026 to 2030 and state DOT contract awards of $159 billion in FY2026, 60% above 2022.
- The towers and structures business makes transmission poles and substation structures. Slide 9 reports that “Backlog has more than doubled YTD, and extends into Q1 2028,” and that “North American transmission spend exceeded ~$65 billion in 2025, and is on pace to grow to over $100 billion by 2030.” Nucor announced a $165 million expansion in Indiana and Alabama to add about 50% capacity and raised its long-term annual EBITDA target for the business from $150 million to about $200 million. It is qualified with more than 30 utilities and has multi-year supply agreements with several of the largest.
- Autos are a market where Nucor says it is underweight. Its flat-rolled automotive shipments are up 4% year to date, and the new automotive galvanizing line at Berkeley in South Carolina, with 500 thousand tons of capacity, started in October and targets 50% utilization in Q2 2027 and full output by the end of 2027. In West Virginia, after the first heat in September and the first coils to internal divisions in October, the hot mill, cold mill and construction-grade galvanizing line should make first coils by December, “building to 50% utilization run rate by YE 2027.” The 10-K puts the mill’s net cash outlay at about $3.65 billion.
How Nucor Compares With Three US Steel Peers
- The peers share the same US steel demand and import competition. Steel Dynamics also makes sheet and bar in electric arc furnaces, Cleveland-Cliffs is an integrated blast-furnace producer focused on automotive sheet, and Commercial Metals is an electric arc furnace producer centered on rebar.
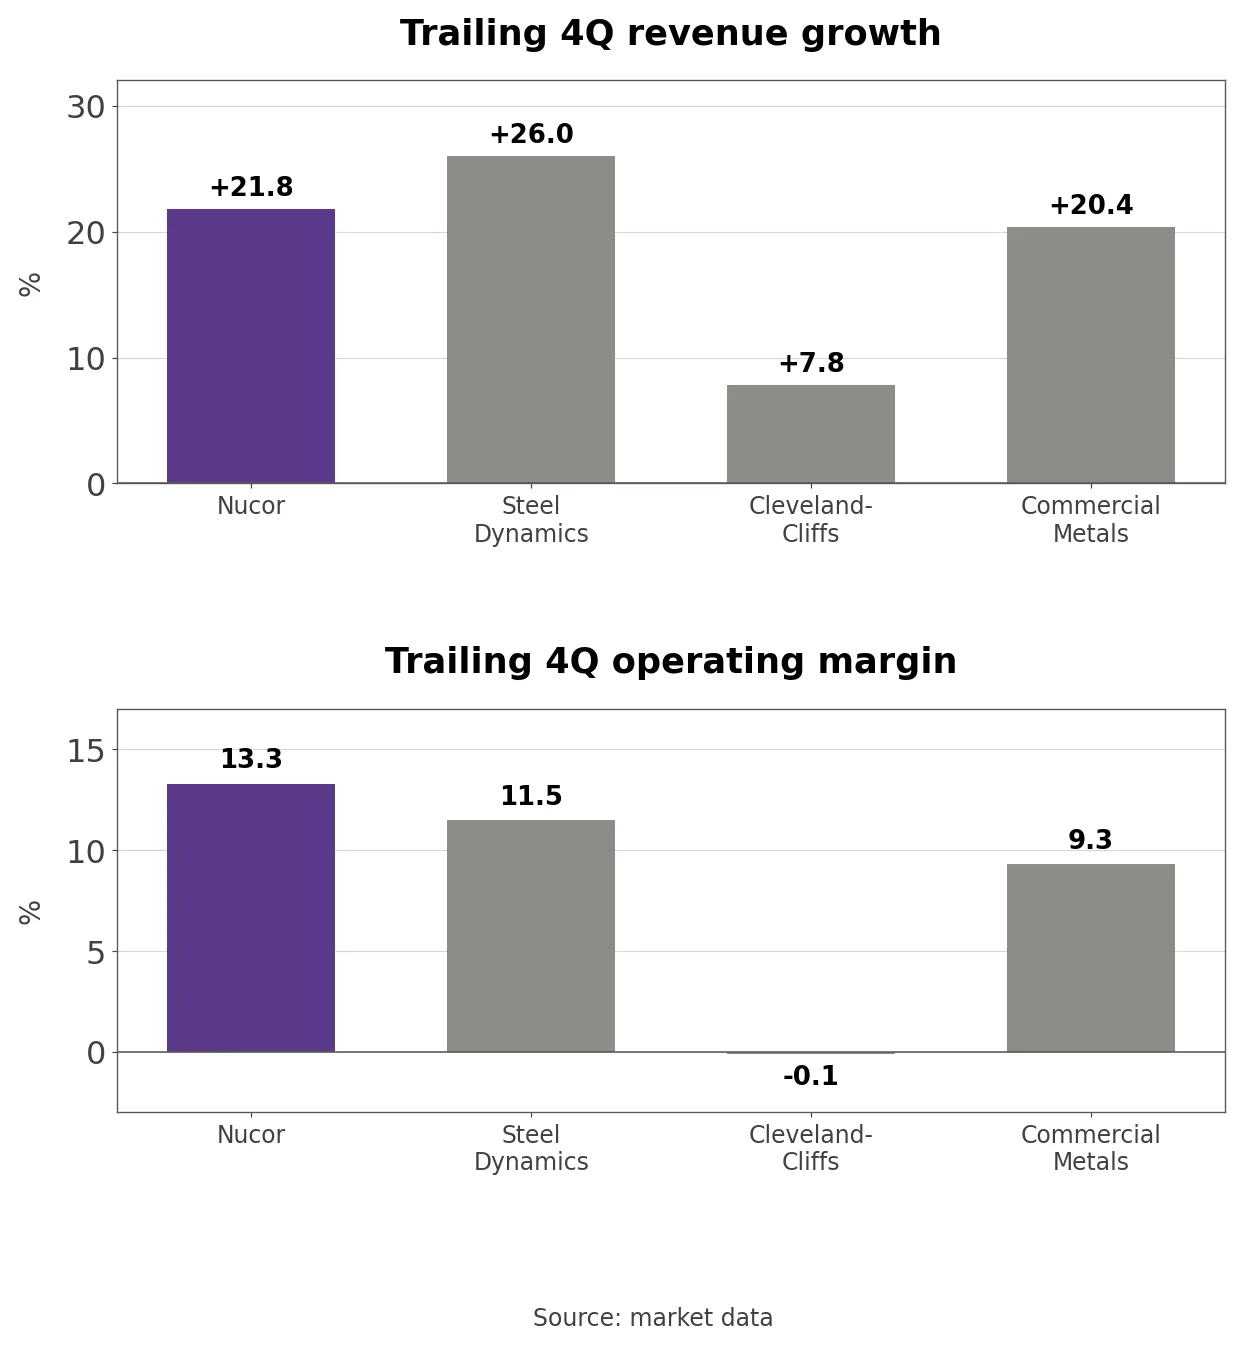
- Over each company’s latest four quarters, revenue grew +26.0% at Steel Dynamics, +21.8% at Nucor, +20.4% at Commercial Metals and +7.8% at Cleveland-Cliffs (Commercial Metals through its August 2026 quarter). Operating margin was 13.3% at Nucor, 11.5% at Steel Dynamics and 9.3% at Commercial Metals, while Cleveland-Cliffs was at -0.1%, close to an operating loss. Within the same demand recovery, the scrap-based producers earn the higher margins.
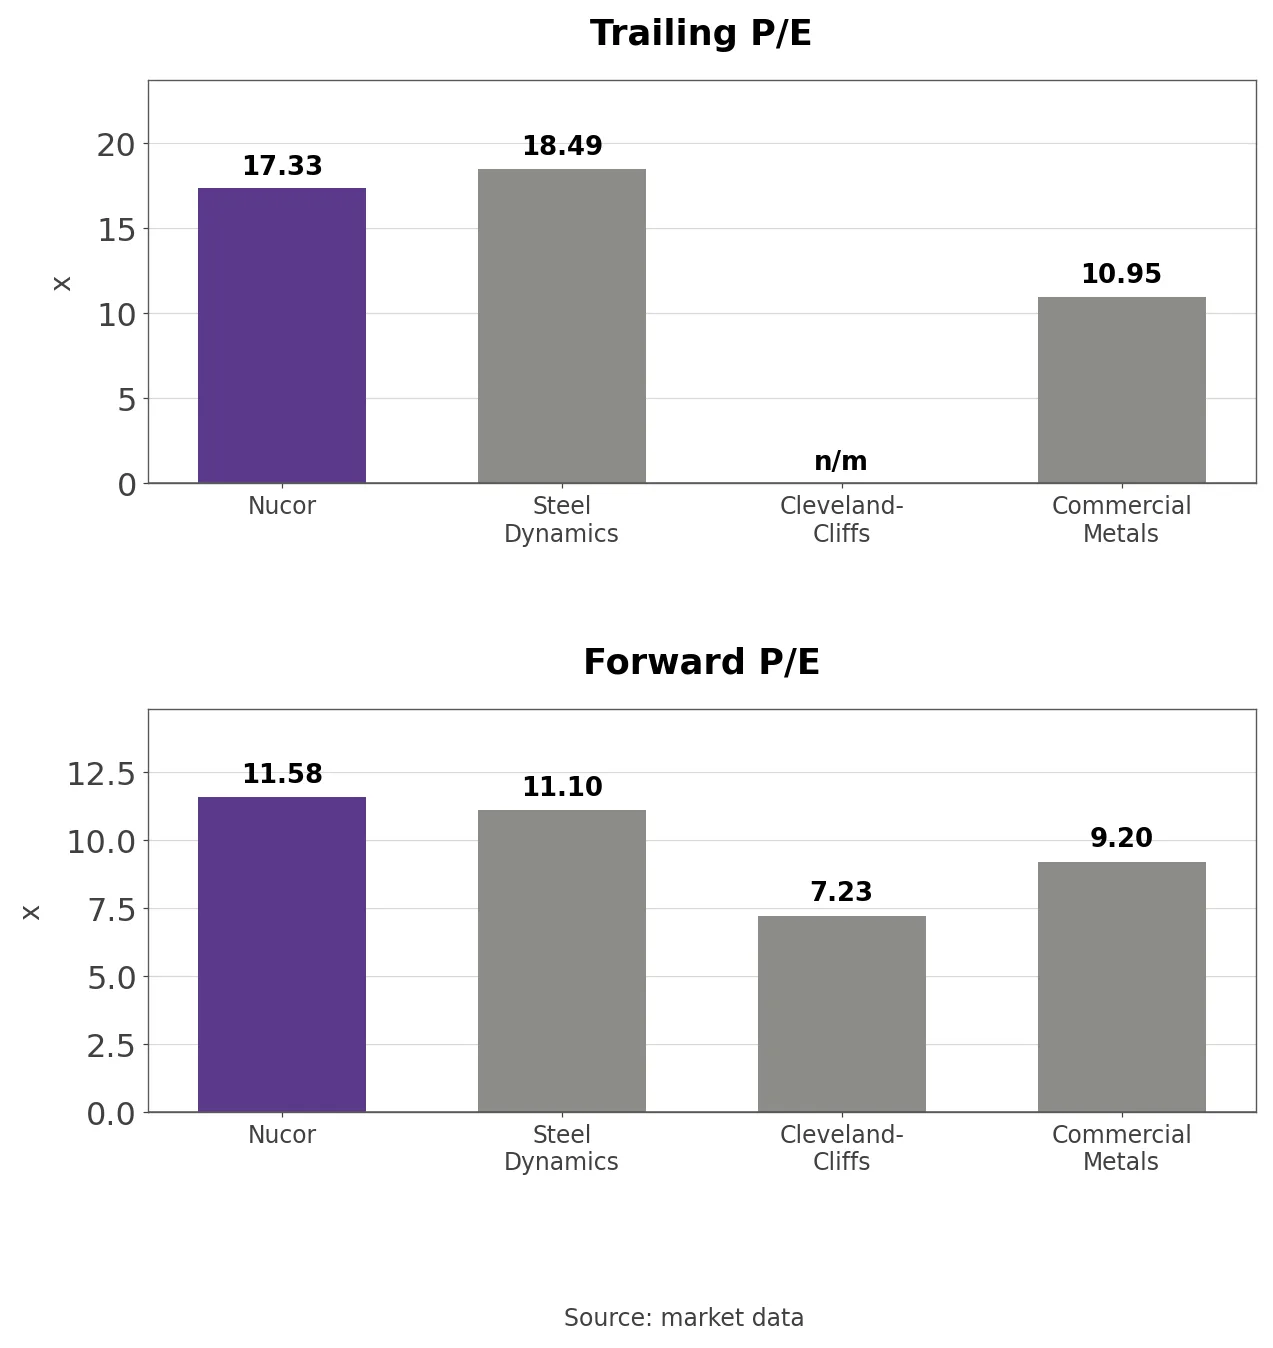
- Trailing P/E is 18.49 for Steel Dynamics, 17.33 for Nucor and 10.95 for Commercial Metals, and Cleveland-Cliffs lost money over the past four quarters. Forward P/E is 11.58 for Nucor, 11.10 for Steel Dynamics, 9.20 for Commercial Metals and 7.23 for Cleveland-Cliffs. The two sheet-focused electric arc furnace producers trade at similar multiples, and Nucor, with the best margin, carries the highest forward multiple.
- The balance sheet sets Nucor apart: net debt of $3.45 billion is 0.5 times trailing EBITDA, and its A-, A- and A3 ratings are the highest among North American steelmakers. Committed to returning at least 40% of annual net earnings, Nucor returned $1.362 billion through Q3, 42.3% of nine-month net earnings of $3.218 billion, including 2.03 million shares bought at an average $247.04.
Nucor’s P/E and Price-to-Book Band
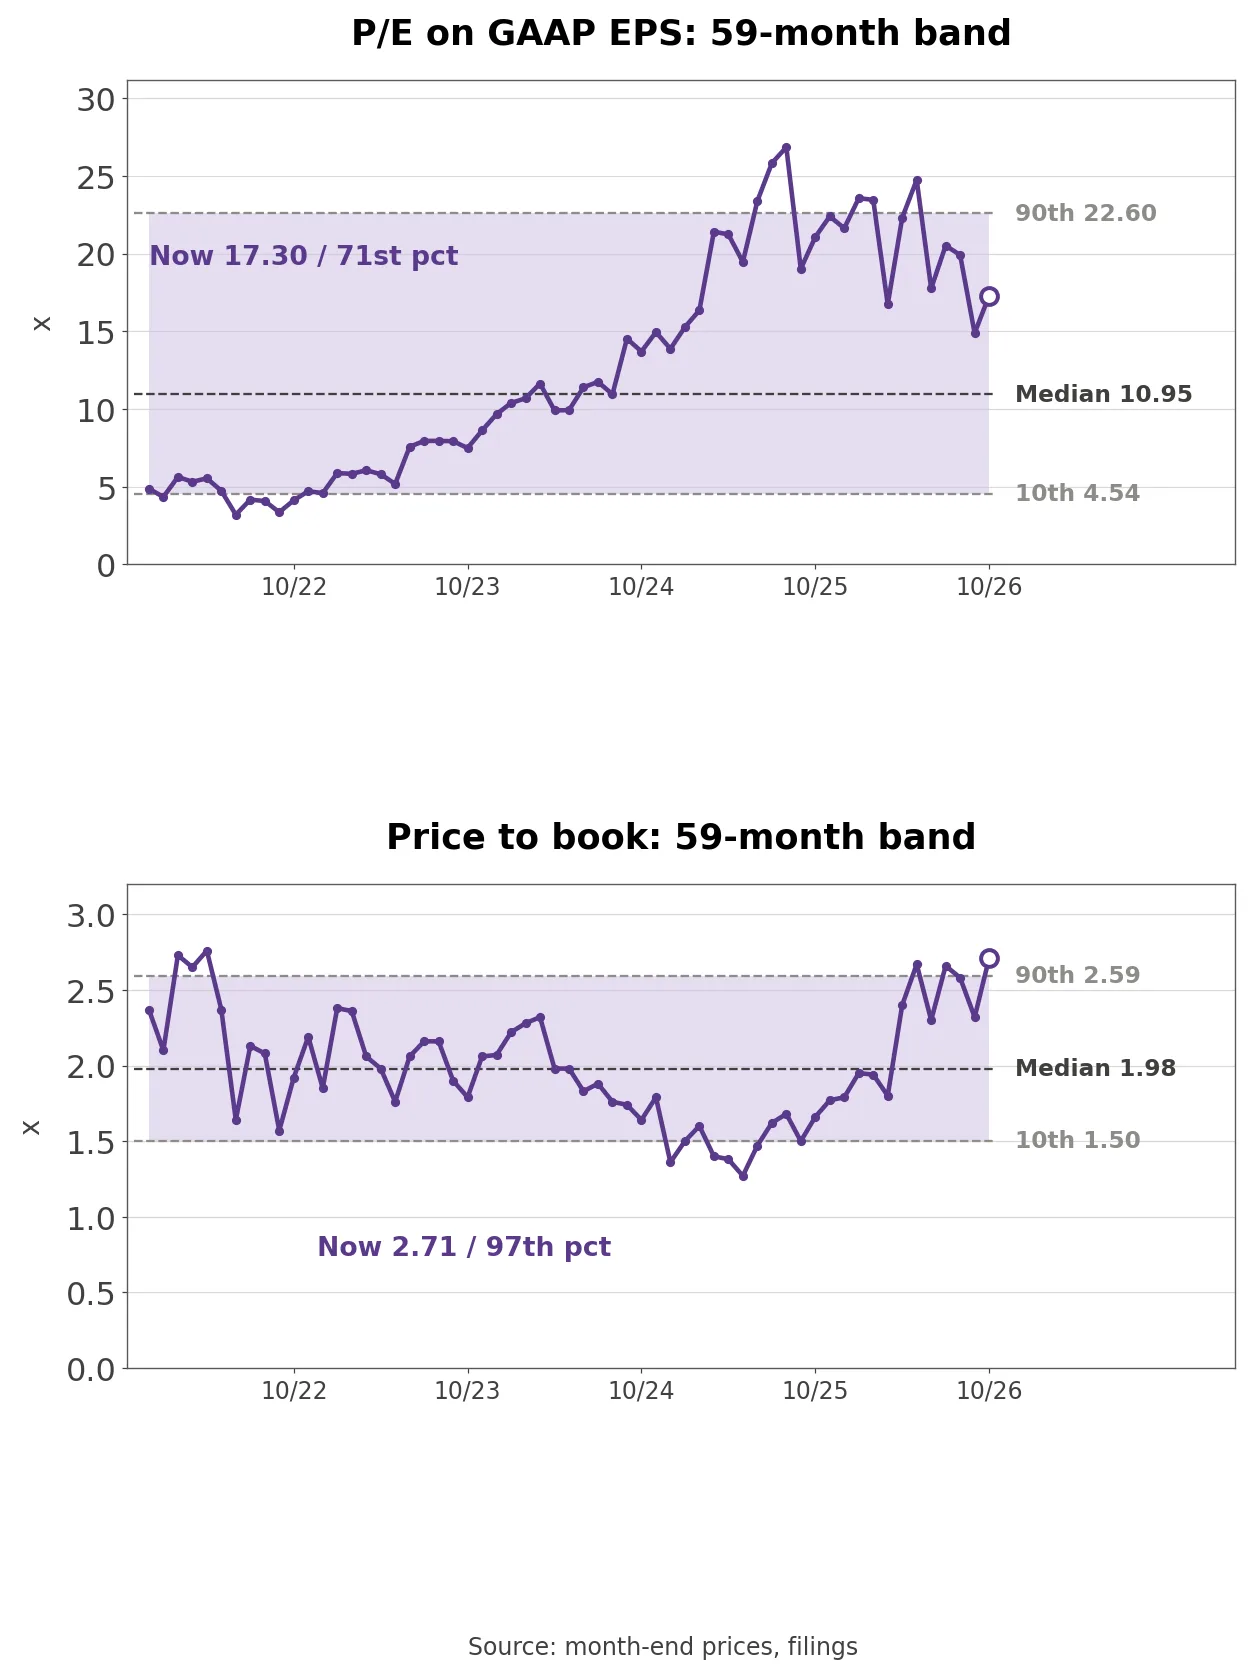
- The P/E on TTM GAAP diluted EPS is 17.30, in the 71st percentile of the 59 months since December 2021, the first month with four quarters of data. The median is 10.95, the low 3.20 in June 2022 when earnings peaked, and the high 26.85 in August 2025 when earnings bottomed. In a cyclical business the multiple is lowest when profit is highest, so the P/E alone says little about value here.
- Price-to-book says more. At 2.71 it sits in the 97th percentile, just under the April 2022 high of 2.76. TTM EPS was $27.96 then and is $15.71 now, 48.2% of the June 2022 peak of $32.59. A peak-era book multiple on half the peak earnings means the market expects this upturn to last longer than 2022’s, carried by higher volume and lower capital spending.
- Outside view (consensus estimates, market data): Average EPS estimates are $5.67 for Q4, $19.53 for 2026 and $21.02 for 2027. The 2027 figure is 16.3% above its level 90 days earlier, putting the stock at 12.9 times 2027 and 13.9 times 2026 estimates. The Q4 estimate sits below the company’s guidance of earnings in line with or modestly above Q3’s $5.80.
Three Conditions That Move the Stock
- Sheet price was $1,189 a ton in Q3, +21.1% from a year earlier. If prices keep rising in Q4 as guided and offset the seasonal drop in shipments, the spread closes more of the distance to its 2021 peak; if prices roll over, the wider $565 cost gap eats into earnings per ton first.
- Import share rose from 14.3% in Q4 2025 to 17.2% in Q3 2026, three quarters in a row. If trade cases and Section 232 enforcement push the share back below 15%, domestic prices hold; if imports under the tariff, like those from Korea, push it toward 20%, the price pressure the 10-K warns about arrives.
- West Virginia utilization targets 50% by the end of 2027. If shipments ramp on schedule and 2027 capital spending falls, depreciation and start-up costs spread over more tons and free cash flow grows; if the ramp slips, 2027 start-up costs at or above 2026’s keep weighing on earnings.
What to Watch in the Fourth-Quarter Report
- The next numbers come with Q4 results around January 2027. The first check is whether price rose enough to hold earnings per ton at $247 while mill shipments followed their usual seasonal drop of about 7%. Nucor also said it would lay out its 2027 capital plan on that call, along with the timing of West Virginia’s first commercial shipments.
- One question remains open. Filings do not split the $565 gap between the part that shrinks as volume grows, depreciation and start-up costs, and the part that stays, such as energy and labor. If imports rise again and prices turn, which side of that gap will Nucor’s profit per ton lean on first?
Related Analysis
- Linde (LIN) Stock Analysis: Price, Volume and Margin Trends: another industrial materials company where results split into price and volume, useful for comparing how pricing drives margin at Nucor’s mills.
- Texas Instruments (TXN) Stock Analysis: Cash Flow and Capex: a company coming off a heavy capital spending cycle, a direct parallel to Nucor’s falling capex and rising free cash flow.
- Sumitomo Electric (5802) Stock Analysis: Data Center Optics: a supplier riding data center and power grid spending, the same demand behind about 15% of Nucor’s backlog.